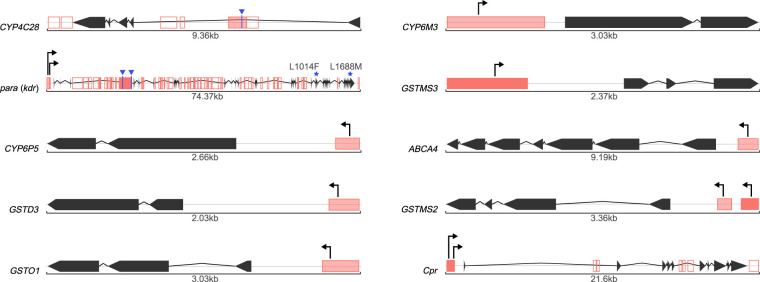
Figure 5.
TE insertions in the neighborhood of genes involved in insecticide resistance. Gene structures are shown in black with arrows representing the exons. TE insertions are depicted as red boxes. When containing a TFBS for cnc or a promoter they are filled in red, otherwise they are empty. The red color is darker on fixed TEs and lighter on polymorphic TEs. Promoters are shown as arrows, and cnc binding sites are shown in blue. Resistance mutations are shown for para (kdr).

