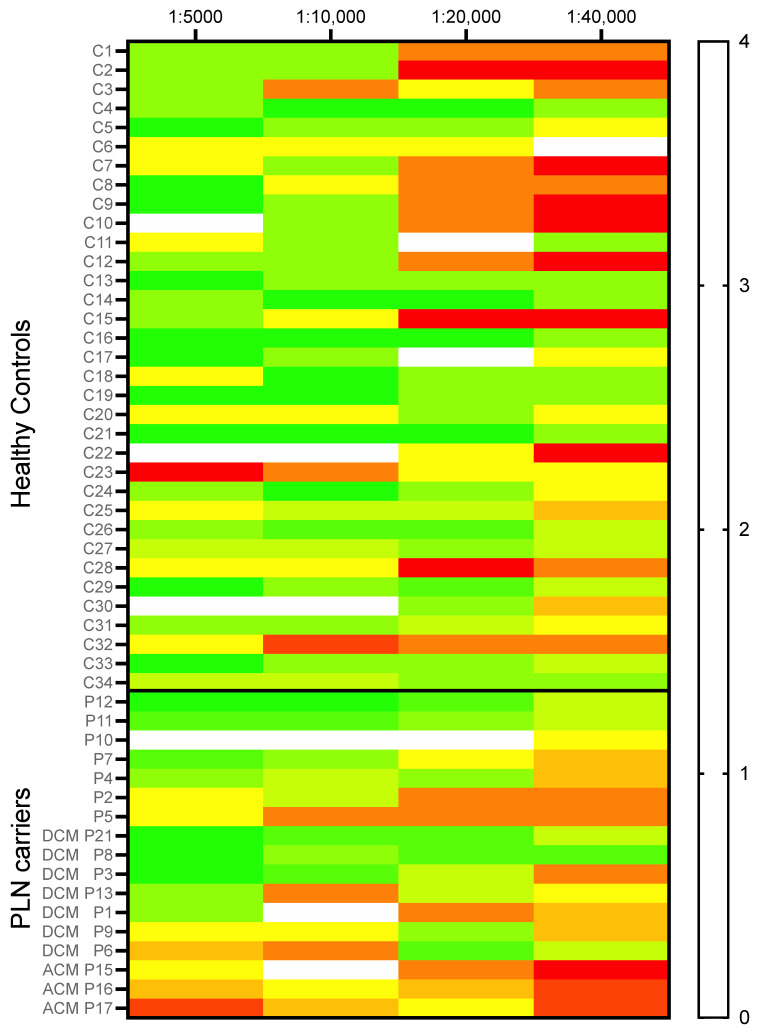
Figure 6.
A heat map visualizing plakoglobin scores of all individual healthy controls (n = 34) and PLN carriers (n = 17), for all four dilutions. No clear difference was found between controls and PLN carriers in plakoglobin score. Colors correspond to score as shown in the right panel. At the left axis, controls (C) and PLN p.Arg14del patient (P) numbers are indicated. Furthermore, for PLN patients their clinical diagnosis is indicated when specified. PLN; phospholamban, ACM; arrhythmogenic cardiomyopathy, DCM; dilated cardiomyopathy.

