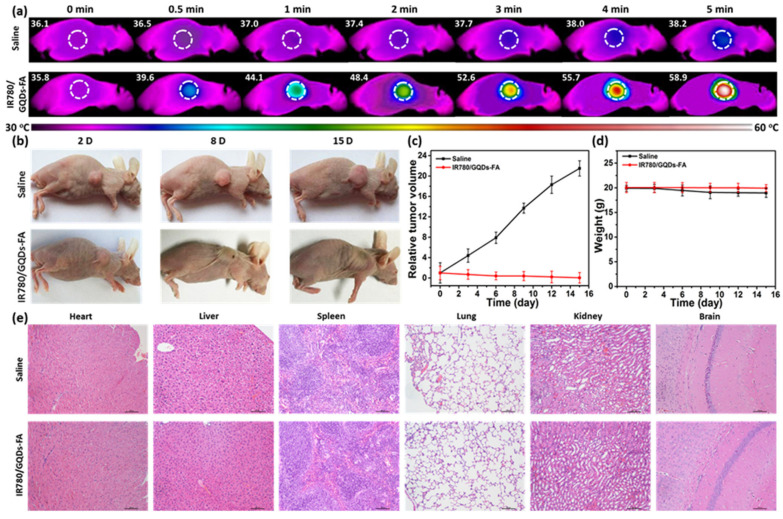
Figure 11.
(a) Tumor thermal images of temperature variations after intravenous injection of saline and IR780/GQDs-FA with laser irradiation; (b) Photos of the tumor-bearing mice after treatments. Tumor volume (c) and body weight (d) curves of the tumor-bearing mice. (e) Histological evaluation of tissues from the mice treated with saline and IR780/GQDs-FA. Each organ was sliced for hematoxylin and eosin (H&E) staining. Reproduced from Ref. [102]. Copyright 2017 ACS.

