Figure 1.

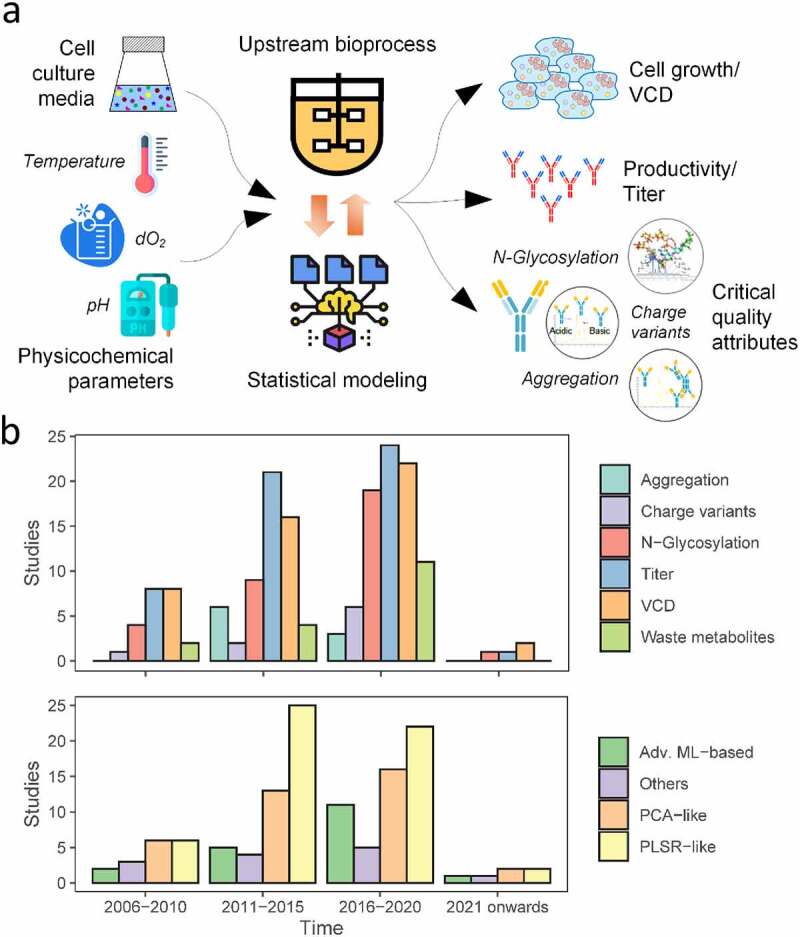
Historical trends of QbD in biomanufacturing. A comprehensive literature survey was performed focussing on studies which employed QbD in upstream bioprocessing to analyze the CPP, titer and CQA inter-relationships. (a) Conventional QbD framework: Selected process parameters are varied within a range as guided by DoE and the corresponding variations in titer and CQAs are measured, and the CPP – titer/CQA interrelationship is analyzed using statistical approaches. (b) Historical trends in the focus of process outputs and the statistical methods used to establish mathematical models.
(a) A flowchart visualizing the inflow of critical process parameters into bioprocesses that use statistical approaches and their effect on critical quality attributes/titer. (b) Bar charts summarizing trends of publications by areas of focus across four time intervals. Top bar chart shows publications by critical quality attributes examined, while the bottom one categorizes by computational method used.
