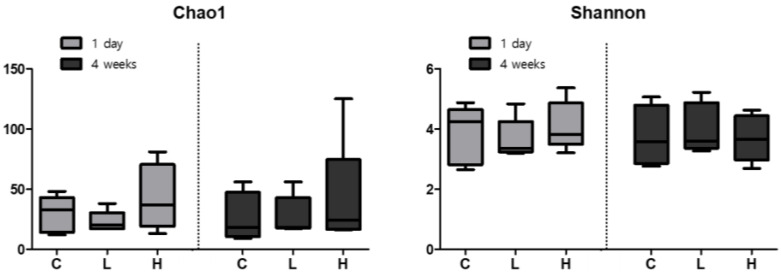
Figure 5.
Alpha diversity, which estimates bacterial diversity and species richness. Bacterial diversity (Shannon; right side) and richness estimates (chao1; left) are divided into two groups, reflecting 1 day (light gray) and 4 weeks (dark gray) after intratracheal instillation of nickel oxide nanoparticles (NiO NPs), by using a boxplot. Community diversity and richness were evaluated using the alpha diversity and were not significantly different between exposure groups of NiO NPs and control group. Median values are shown as a line within the box and error bars indicate the standard error of the samples C: control group; L: low-dose group (50 cm2/rat); H: high-dose group (150 cm2/rat).

