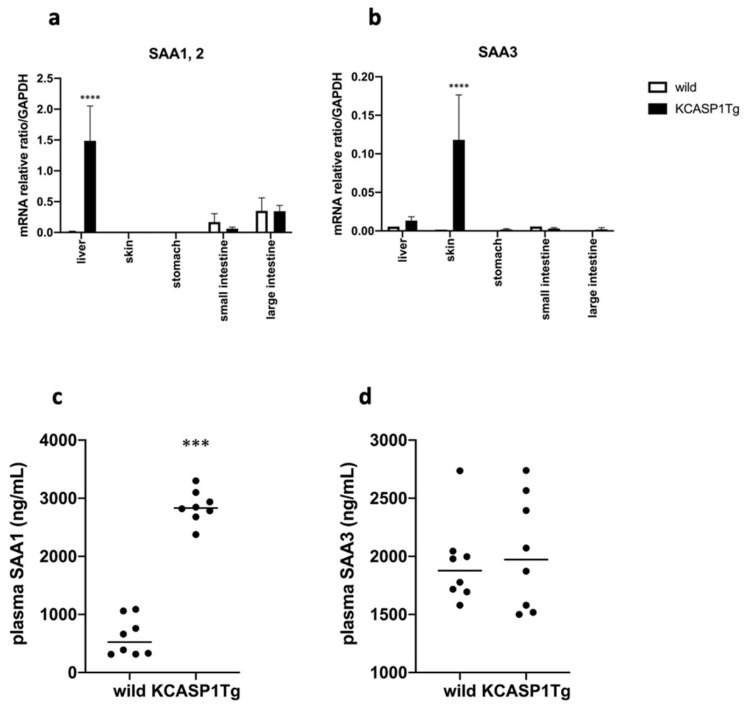
Figure 4.
SAA levels in organs and plasma. (a) The mRNA purified from various organs in the KCASP1Tg and WT mice revealed that there was a higher production of SAA1 and SAA2 in the liver of the KCASP1Tg than in the WT mice. (b) An increased level of SAA3 was detected in the skin of the KCASP1Tg mice. (c,d) The plasma levels of SAA1 were higher in the KCASP1Tg mice than in the WT littermates; however, the plasma levels of SAA3 were similar between the two groups. All data are expressed as means ± SDs. *** p < 0.001, **** p < 0.0001 compared to wild mice by Mann–Whitney test.

