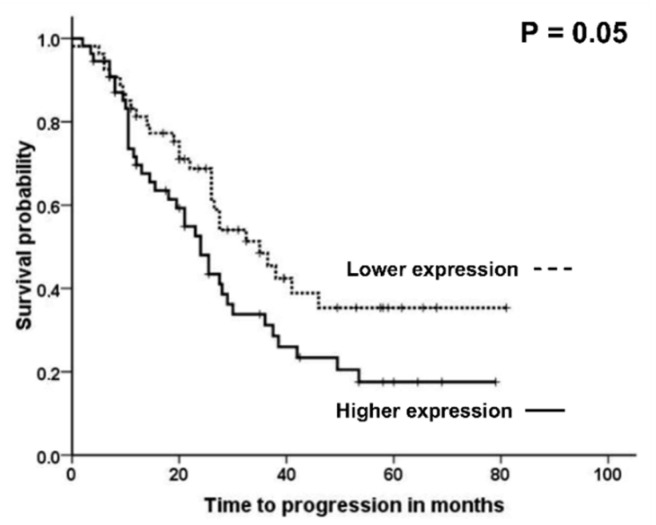
Figure 7.
Association between expression level of CPS1 gene and time to progression of EOC patients. Survival curves for patients with the intratumoral CPS1 expression levels above the median (solid line, n = 55) vs. patients with lower expression than the median (dashed line, n = 54) are displayed. Results evaluated by the Kaplan-Meier plot. Significance was evaluated by the log-rank test.

