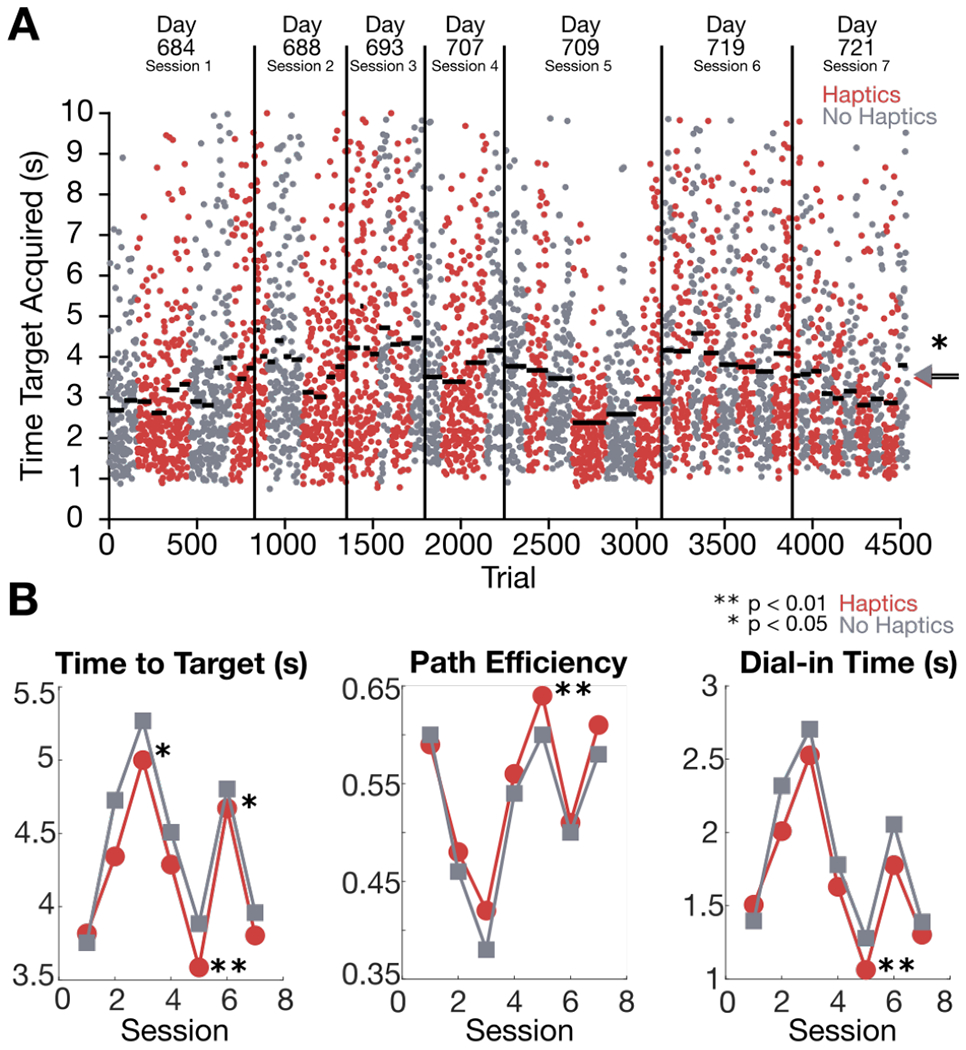
Fig. 10:

iBCI cursor control performance with and without haptic feedback. (A) Timeline of iBCI comparison blocks across 7 sessions (day numbers are days after implantation). Red clusters indicate Haptics blocks where the participant received skin-shear haptic feedback, and gray clusters indicate No Haptics blocks where haptic feedback was disabled. Each dot shows one trial’s time to target. Horizontal bars show the median time to target of each block. Arrows on the right show the median across all trials of each condition. (B) Median time to target, path efficiency, and dial-in time within each session is plotted for each condition. Asterisks indicate statistical significance level: * p≤ 0.05, ** p≤ 0.01.
