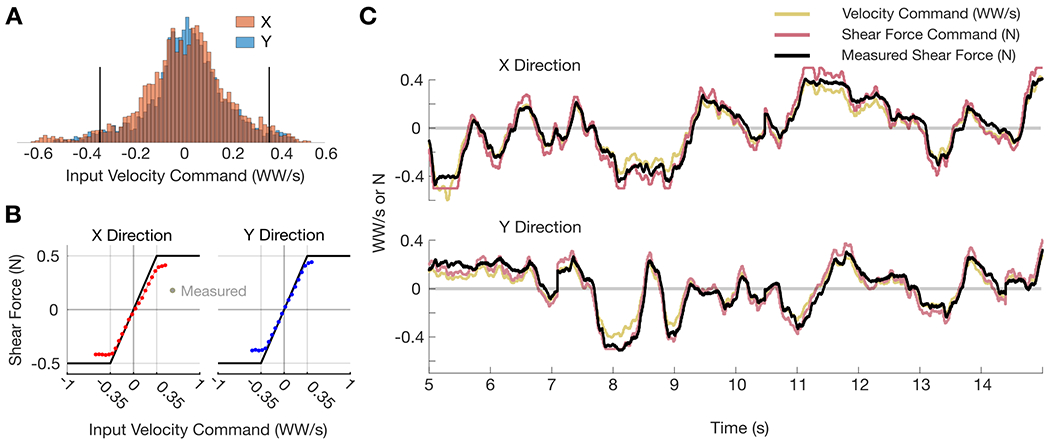
Fig. 3:

Velocity-shear mapping function and force tracking. (A) Distribution of X- and Y-direction velocity commands from a typical closed-loop iBCI cursor control task. Units are in workspace width per second (WW/s). Black lines bound the 95th percentile (±0.35 WW/s). (B) Velocity-shear saturation function (black line) with average measured force plotted as a function of velocity command for the X (red) and Y (blue) directions. The 95% CIs are plotted but are smaller than the width of the plotted points. Data is from a 10-minute iBCI cursor control block with haptic feedback. (C) Force tracking example from a 10 second snippet of data from the task used in panel B. Velocity commands (gold) are mapped to shear force commands (purple) using the function in panel B. The black trace is measured force sensor data.
