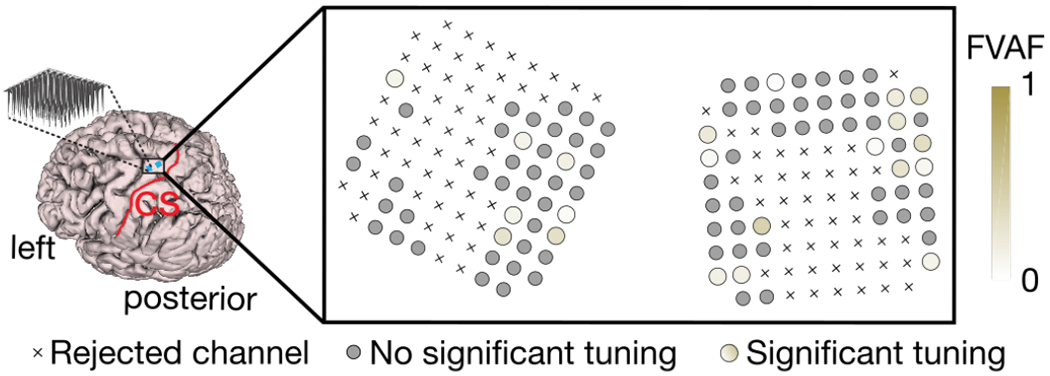
Fig. 8:

Shear-related tuning strength across electrode arrays. The strength of each electrode’s tuning to shear stimulus is indicated with a shaded gold color (darker indicates more tuning). Tuning strength was quantified by computing the fraction of total firing rate variance accounted for (FVAF) by changes in firing rate due to the stimulus directions. Crosses represent “non-functioning” electrodes. Small gray circles indicate channels with no significant tuning to shear stimulation. Larger colored circles indicate significantly tuned channels.
