Figure 2.
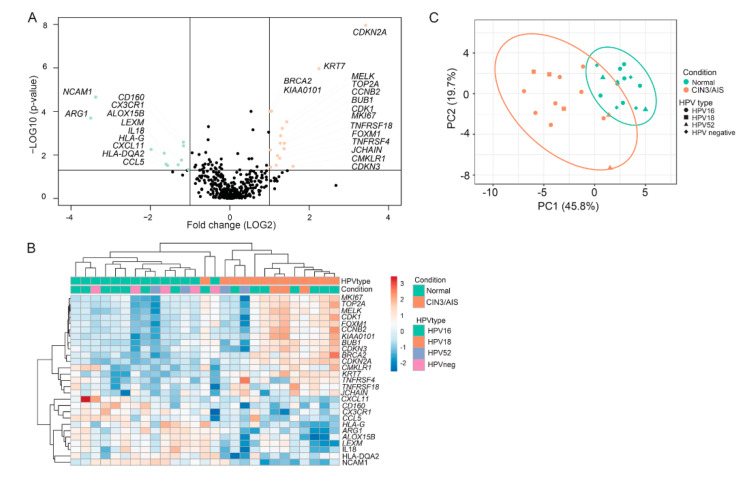
Gene expression from the 27 cervical biopsies (14 normal and 13 CIN3/AIS biopsies) were analyzed using Oncomine™ Immune Response Research Assay. (A) Distribution of p-values (−log10) as a function of fold change (log2) between CIN3/AIS and normal biopsies. Differentially expressed genes (DEGs, fold change > |2| and p < 0.05) showing downregulation in CIN3/AIS are depicted in green, whereas genes upregulated in CIN3/AIS are depicted in orange. (B) Hierarchical clustering based on the 27 significant DEGs with correlation clustering distance and average linkage. The HPV status is included; HPV16 (green), HPV18 (orange), HPV52 (purple) and HPV negative (pink). (C) Principal component analysis (PCA) of the first two principal components of the gene expression data. Each point represents a biopsy, normal (green), and CIN3/AIS biopsies (orange).

