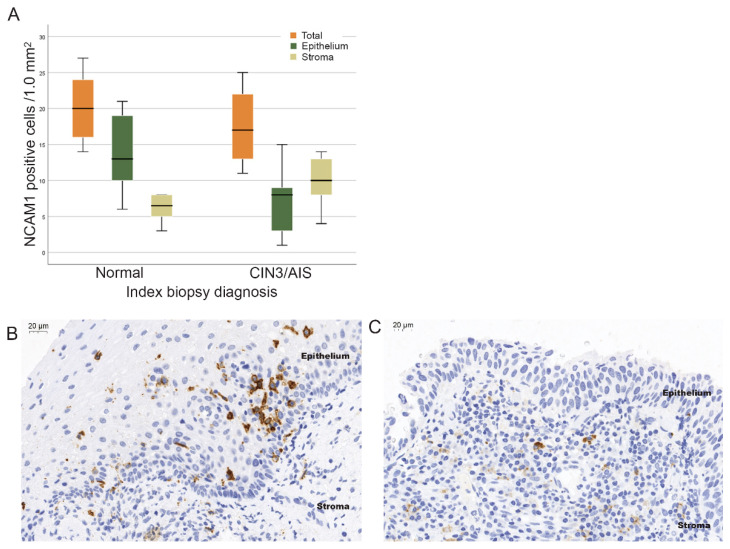
Figure 3.
Protein expression of NCAM1. (A) Boxplots illustrating the distribution of NCAM1 positive cells/1.0 mm2 of normal and CIN3/AIS biopsies: in total (orange), in the epithelium (green) and in the stroma (olive green). Immunohistochemical staining of NCAM1 positive lymphocytes in (B) a normal biopsy and (C) a CIN3 biopsy (40× magnification).

