Figure 6.
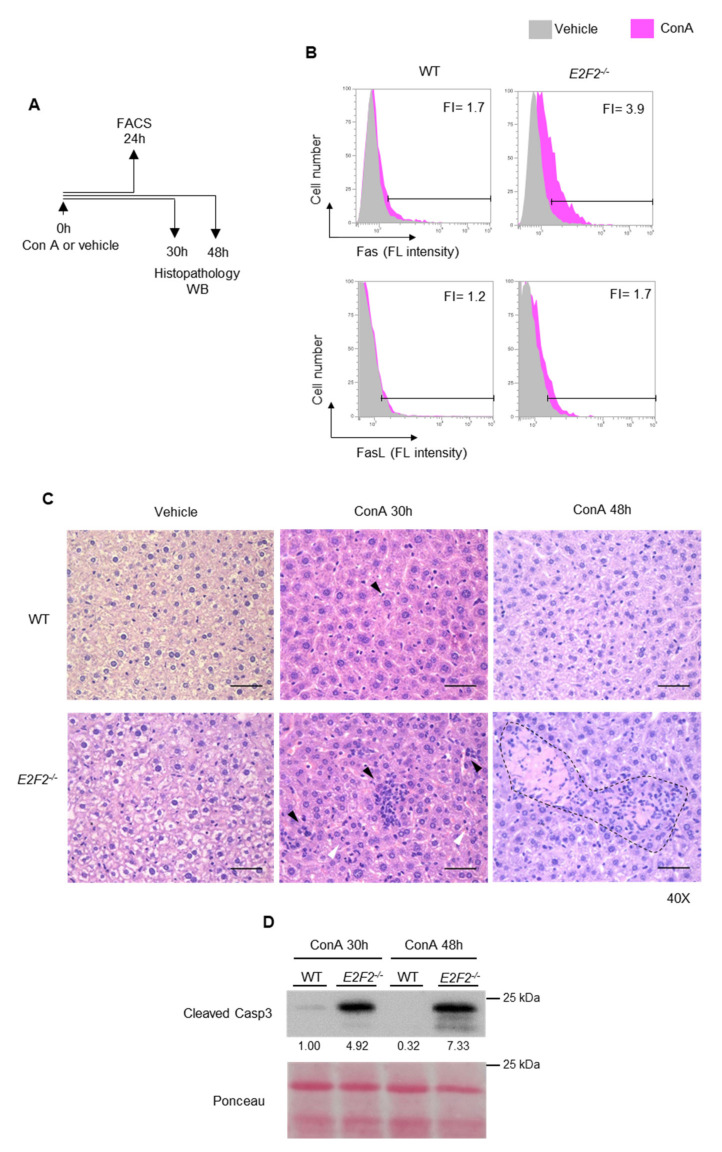
E2F2 loss enhances sensitivity to ConA-induced T-cell activation and immune-mediated liver injury in vivo. (A) Experimental set up for FACS analysis, Western blot, and histopathology after the iv injection with ConA (20 mg/kg). (B) Results of FACS analysis to detect surface Fas and FasL expression in cells purified from lymph nodes form WT and E2f2−/− mice 24 h after injection with ConA (pink histogram) or vehicle control (gray histogram). X axis contains the values of fluorescence intensity (FL intensity). The results are expressed as fold increase (FI) of fluorescence intensity mean in ConA-treated samples over vehicle-treated samples. (C) Liver sections obtained from WT and E2f2−/− animals 30 and 48 h after injection with ConA or vehicle control, and stained with hematoxylin/eosin (H/E, ×40, scale bar = 50 μm). Black arrowheads indicate infiltrated inflammatory cells and white arrowheads point to shrinking nuclei of hepatocytes. Note the enhanced infiltration and enhanced necrotic area (marked with dash line) in E2f2−/− animals after the treatment with ConA for 30 h and 48 h, respectively. (D) Western blot analysis of Cleaved Caspase 3 in extracts prepared from livers of WT and E2f2−/− mice 30 and 48 h after injection with ConA. Ponceau staining was used as loading control. Numbers below the bands correspond to the relative densitometric levels expressed as fold-over WT ConA at 30 h.

