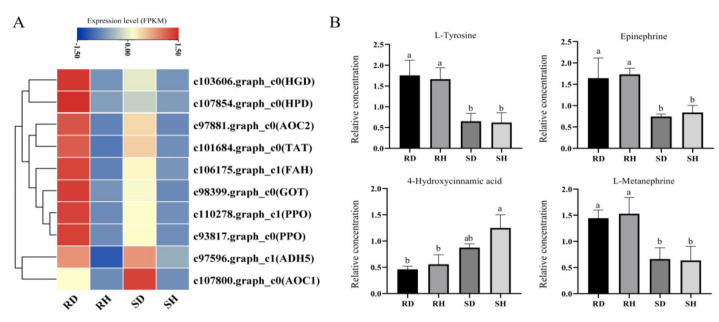
Figure 6.
(A) Expression of DEGs in tyrosine metabolism pathway among the four sample groups, data of each row was standardized. (B) Relative concentration of four DAMs in tyrosine metabolism pathway among the four sample groups, different letters represent significant difference at p < 0.05 by Duncan.

