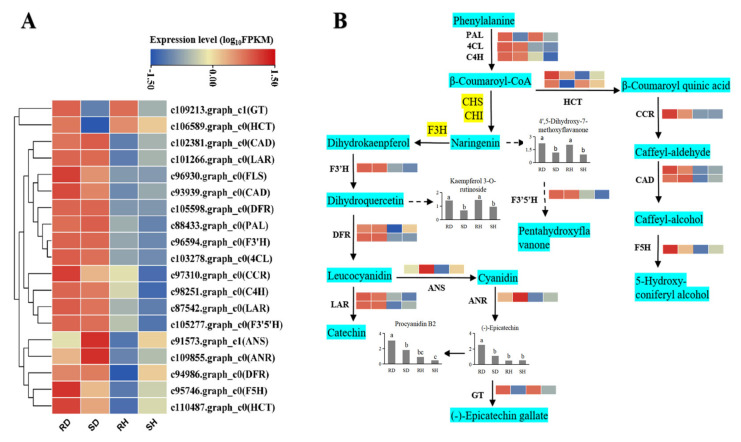
Figure 7.
Expression of candidate genes involved in flavonoid biosynthesis. (A) The expression profile of key genes among the four sample groups, data of each row was standardized. (B) The postulated biosynthetic pathway of flavonoids after Co. gloeosporioides infection. The four squares in each horizontal row correspond to the four sample groups. The light blue boxes indicate different enzymes. The bar graph represents the relative metabolic content.

