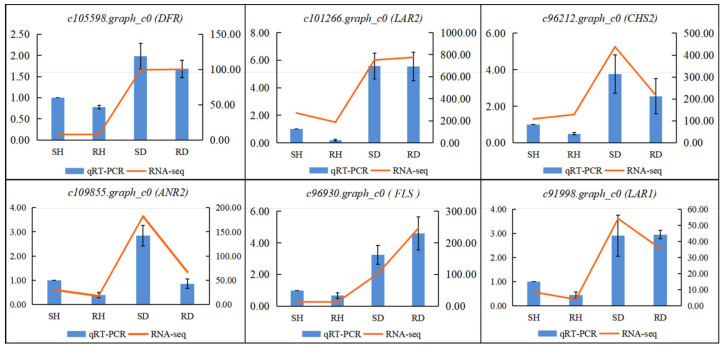
Figure 8.
The relative expression levels of six selected DEGs were compared by RNA-seq and qRT-PCR. The line chart shows the gene expression level from the transcriptome (FPKM); The qRT-PCR expression levels were calculated as a ratio relative to the level of expression of uninfected susceptible line CL102 (SH), which was set as 1.

