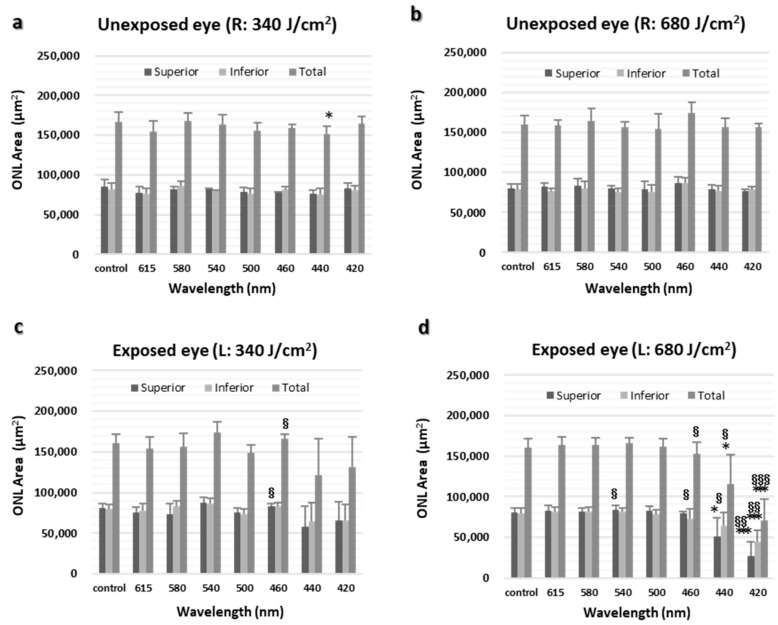
Figure 3.
ONL area. (a) ONL area of normal retina (right eye) and opposite retina exposed to 340 J/cm2 (right eye). (b) ONL area of normal retina (right eye) and opposite retina exposed to 680 J/cm2 (right eye). (c) ONL area of normal retina (left eye) and retina exposed to 340 J/cm2 (left eye). (d) ONL area of normal retina (left eye) and retina exposed to 680 J/cm2 (left eye). L, left eye; R, right eye. The data are expressed as mean ± SD (n = 6 in each group). Both eyes were compared using the paired t-test, and between-group comparisons were performed using the unpaired t-test. * p < 0.05 and *** p < 0.001 vs. normal control eyes and § p < 0.05, §§ p < 0.01, and §§§ p < 0.001 vs. unexposed eyes.

