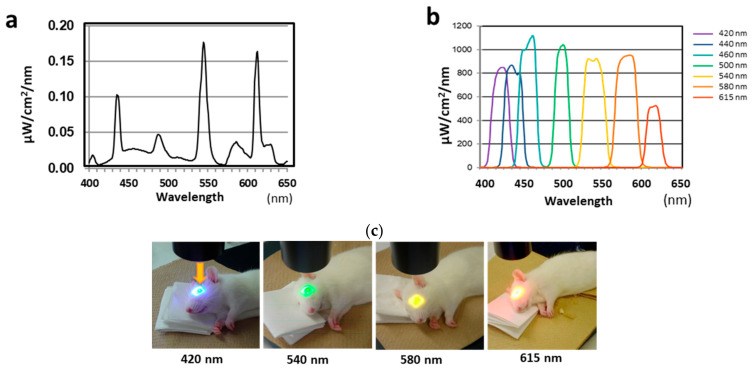
Figure 5.
Spectral distributions of white fluorescent light from a xenon lamp and rats exposed to light. (a) Spectral distribution of white fluorescent light. (b) Spectral distribution of light from a xenon lamp source. (c) Rats exposed to light of different wavelengths. Arrow indicates the direction of the exposed visible light.

