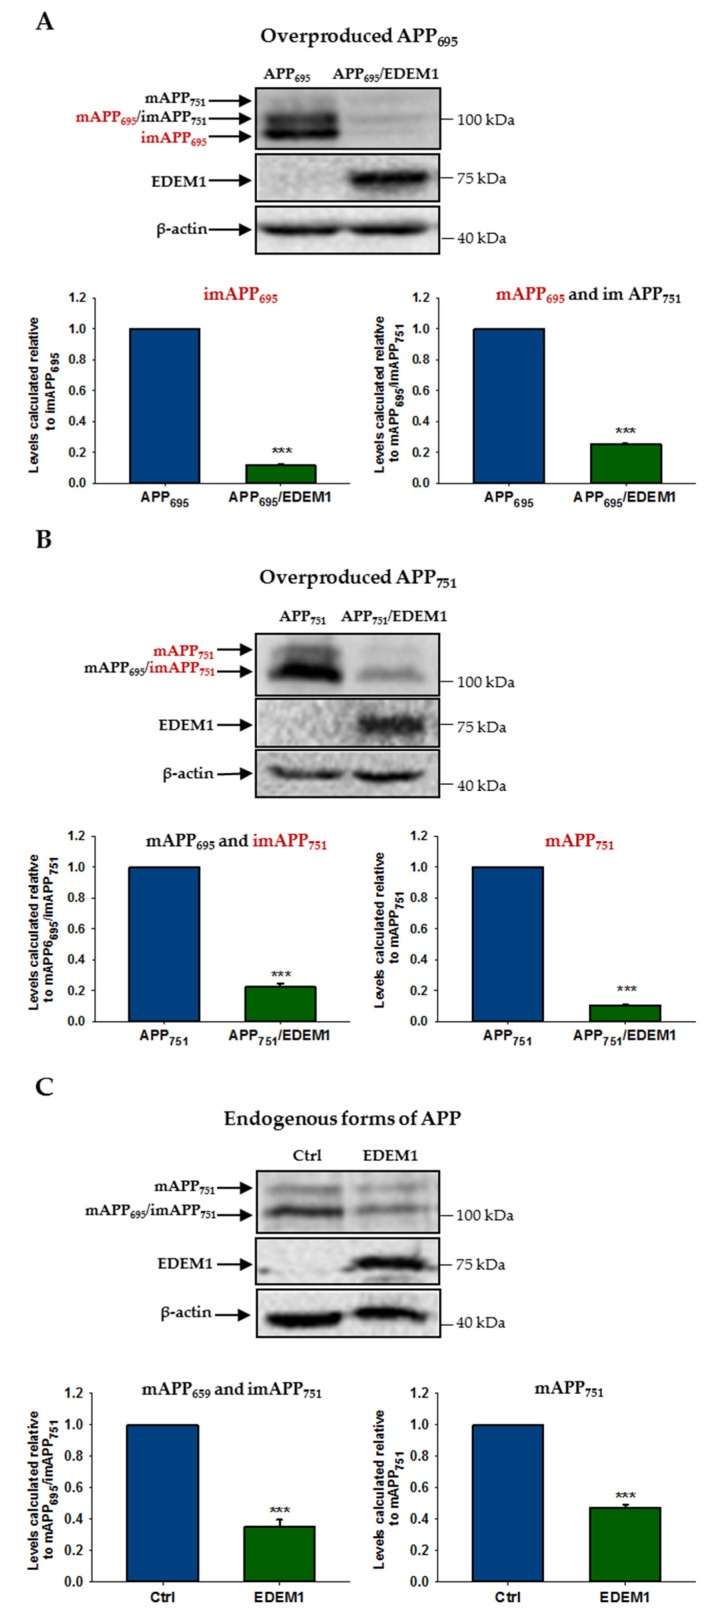
Figure 3.
The level of various APP isoforms is reduced in HEK293 cells overexpressing EDEM1. Western blotting of APP, EDEM1 and actin in lysates of cells transfected with (A) APP695, (B) APP751, or (C) control cDNA with or without EDEM1 cotransfection (as indicated). Overexpressed, dominant forms present in (A,B) are indicated in red. Mature APP is abbreviated as mAPP, and immature APP as imAPP. Representative experiments are shown. Molecular mass markers are shown on the right side of the membranes. The levels of APP isoforms were quantified and are shown in the graphs. Values obtained for lysates of cells without EDEM1 overexpression are indicated as 1. Values representing EDEM1-transfected cells are plotted relative to 1. The values are expressed as mean ± SD, n ≥ 3, *** p ˂ 0.001, Student’s t test.

