Figure 2.
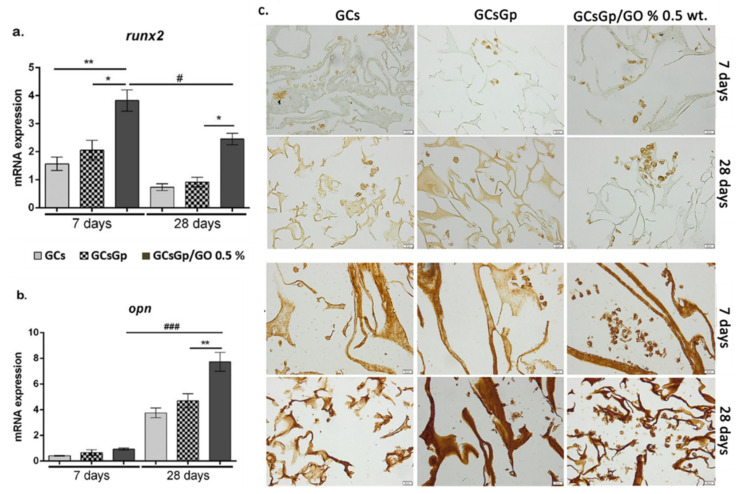
In vitro osteogenic profile analyses of runx2 (a) and opn (b) gene expression in differentiated 3T3-E1 cells in contact with GCsGp/GO materials with statistical significance ### p < 0.001; ** p < 0.01; #,* p < 0.05; (c) immunohistochemical runx2 and opn expression in differentiated 3T3-E1 cells in contact with GCsGp/GO materials.

