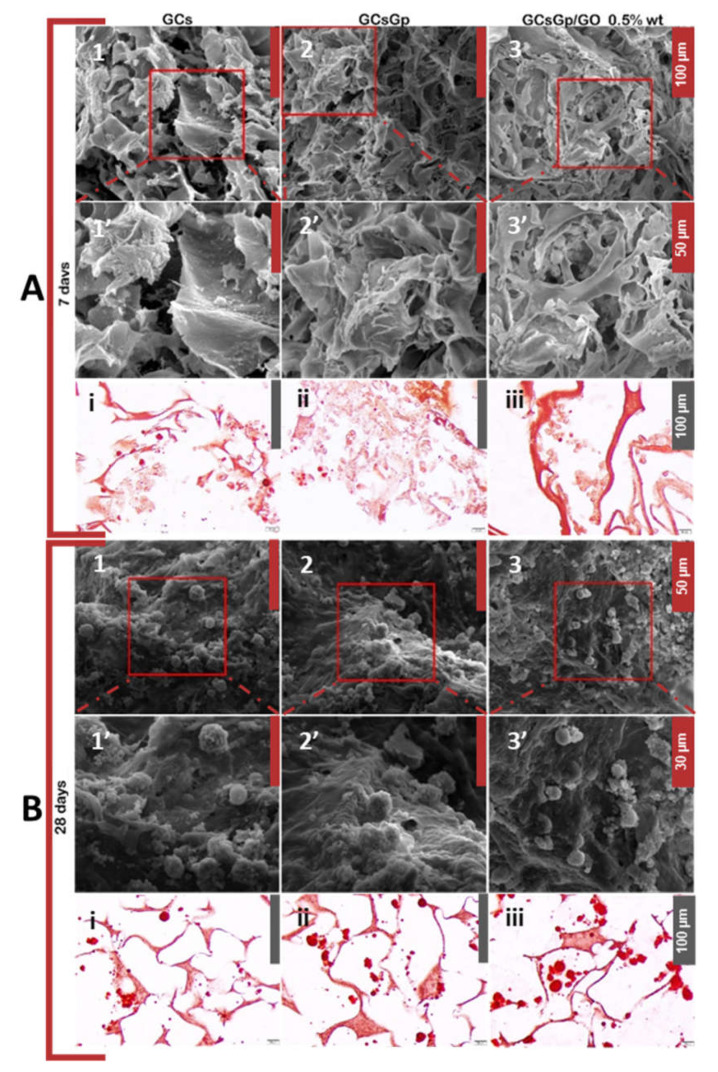
Figure 3.
Qualitative evaluation of cellular distribution and morphology in GCsGp/GO scaffolds during 7 (A1–A3) and 28 (B1–B3) days of osteogenic differentiation using SEM while the A1’–A3’ and B1’–B3’ subsets depict corresponding close-ups of the areas marked in red squares above; qualitative evaluation of in vitro calcium accumulation in bECM using ARS histological staining at after 7 (Ai–Aiii) and 28 (Bi–Biii) days.

