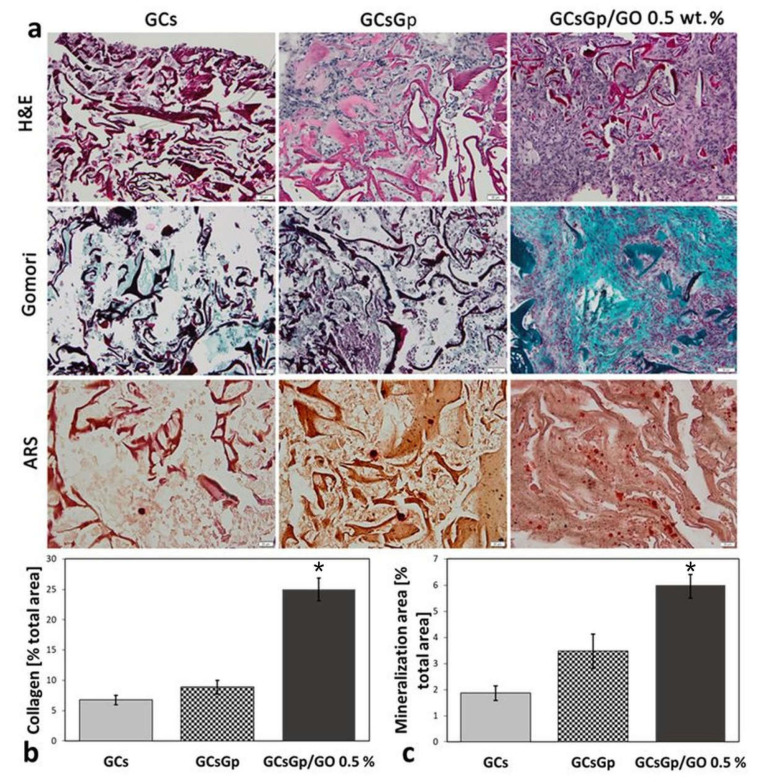
Figure 5.
Histological analysis of the ectopic bone occurrence in GCs, GCsGp and GCsGp/GO 0.5% wt.% Scaffolds 28 days post-implantation. (a) Representative H&E, Gömöri trichrome and ARS stainings. Scale Bar 20 µm; (b) The analysis of the area of collagen domains according to Gömöri staining indicated that significantly more collagen was secreted within GCsGp/GO 0.5% wt.% Group as opposed to GCs group (* p < 0.001); (c). ARS staining indicates that significantly more calcium mineral deposits are present in the GCsGp/GO 0.5% wt.% group than GCs group (* p < 0.001).

