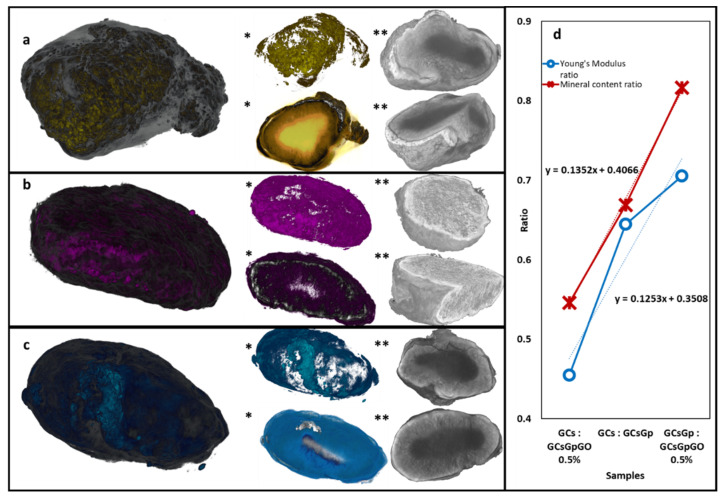
Figure 7.
Colorized µCT images of (a) GCs, (b) GCsGp and (c) GCsGp/GO 0.5% wt.% scaffolds explanted 28 days; (*) marks indicate captures whereby the bi-phasic nature of the samples was separately highlighted and (**) marks indicate sectional views of the central morphology of the samples. (d) Charted data correlating mechanical properties and mineral formation based on the constitutional nature of the composites.

