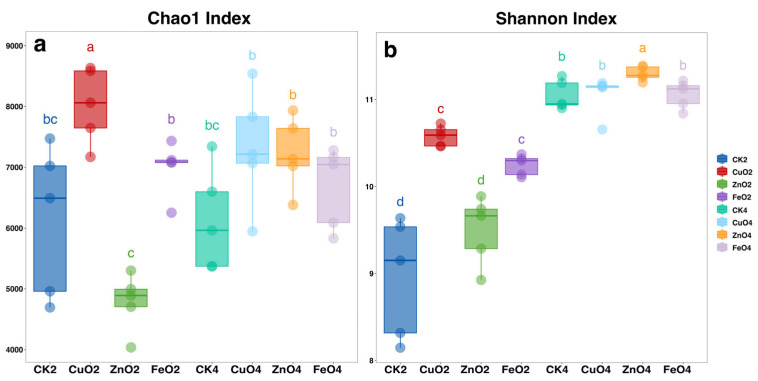
Figure 3.
Chao1 (a), Shannon (b) index under the exposure of CK, CuO, FeO, and ZnO NPs. Different letters reveal the significance among different treatments (p < 0.05). The horizontal bars within boxes represent medians. The tops and bottoms of boxes represent the 75th and 25th percentiles, respectively. The upper and lower whiskers extend to data no more than 1.5× the interquartile range from the upper edge and lower edge of the box, respectively. Abbreviation: second week of nanoparticles treatment (Control2, CuO2, ZnO2, and FeO2), fourth week of nanoparticles treatment (Control4, CuO4, ZnO4, and FeO4).

