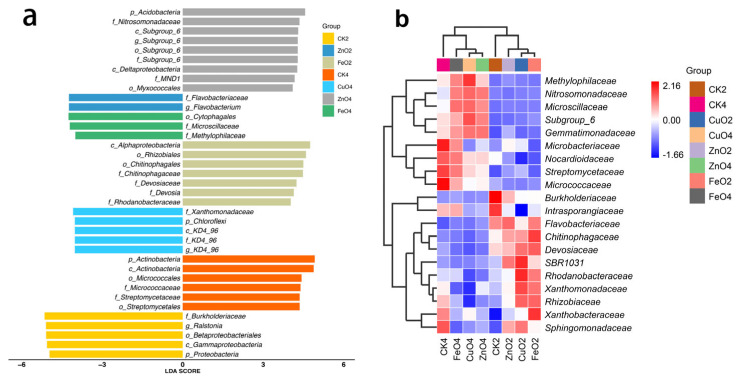
Figure 6.
Linear discriminant analysis (LDA) effect size (Lefse) of the bacterial taxa (a), which identifies the most differentially abundant taxa among the different nanoparticles treatment. Only taxa with LDA values greater than 4 (p < 0.05) are shown. Hierarchical clustering analysis and heat map at the (b) family level. The tree plot represents a clustering analysis of the top 20 bacteria at family levels according to their Pearson correlation coefficient matrix and relative abundance, the upper tree plot represents a clustering analysis of soil samples according to an euclidean distance of data. Abbreviation: 2nd week of nanoparticles treatment (CK2, CuO2, ZnO2, and FeO2), 4th week of nanoparticles treatment (CK4, CuO4, ZnO4, and FeO4).

