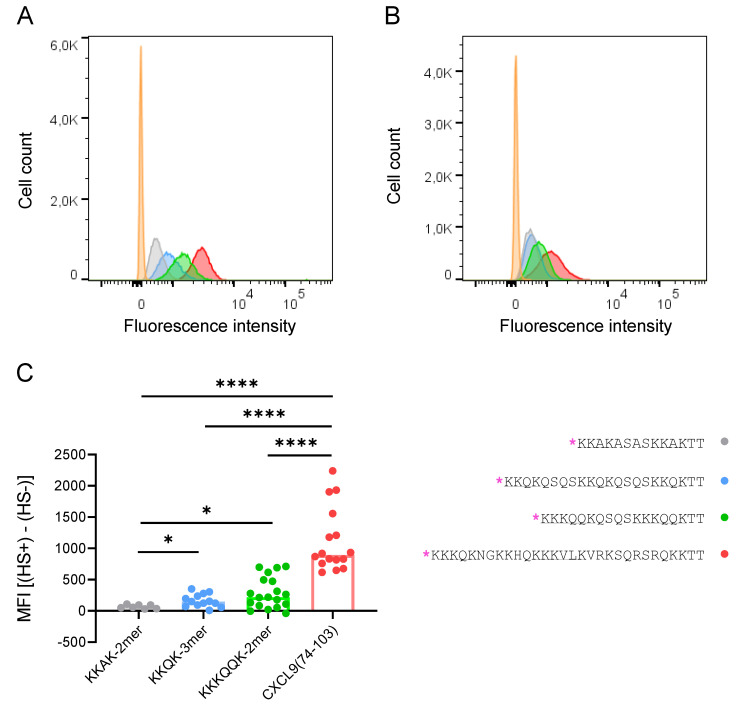
Figure 7.
Peptides show differential binding capacity for cellular GAGs on CHO cells. TAMRA-labeled peptide (0.24 nmol; KKAK-2mer (gray), KKQK-3mer (blue), KKKQQK-2mer (green), CXCL9(74-103) (red), unstained (orange)) was added to either HS+ or HS− CHO cells and binding was assessed using flow cytometry. (A,B) Histograms (of one representative experiment) of the HS+ (A) and HS− (B) CHO cells are shown with the cell count on the y-axis and the fluorescence intensity of the TAMRA-labeled peptides on the x-axis. (C) Median fluorescence intensity (MFI) values were normalized first by subtracting the MFI of the unstained sample (background). The difference between the MFI of the HS+ and the HS− CHO cells is displayed (y-axis) for each peptide (x-axis). (n ≥ 7; Mann–Whitney test, * p < 0.05, **** p < 0.0001 (comparison of the different peptides)). The amino acid sequences of the peptides are depicted on the right with TAMRA indicated in pink [*] and the GAG-binding motifs underlined.

