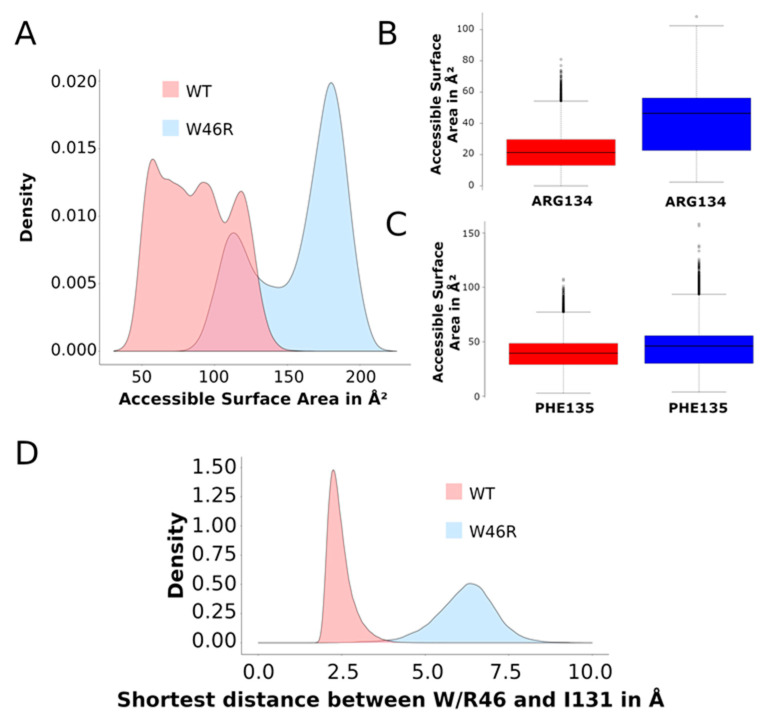
Figure 4.
Accessible surface areas and shortest distances on MDeNM structures. (A) Histogram of accessible surface area (ASA) values of residue W46 in KirBac3.1 WT (in red) and R46 in KirBac3.1 W46R (in blue) obtained on the set of relaxed MDeNM structures. (B) Boxplot of ASA values of R134 in KirBac3.1 WT (in red) and in KirBac3.1 W46R (in blue) over the same set of structures. (C) Boxplot of ASA values of F135 in KirBac3.1 WT (in red) and in KirBac3.1 W46R (in blue) over the same set of structures. (D) Histogram of the shortest distances on MDeNM structures between residue 46 and I131 in KirBac3.1 WT (in red) and KirBac3.1 W46R (in blue).

