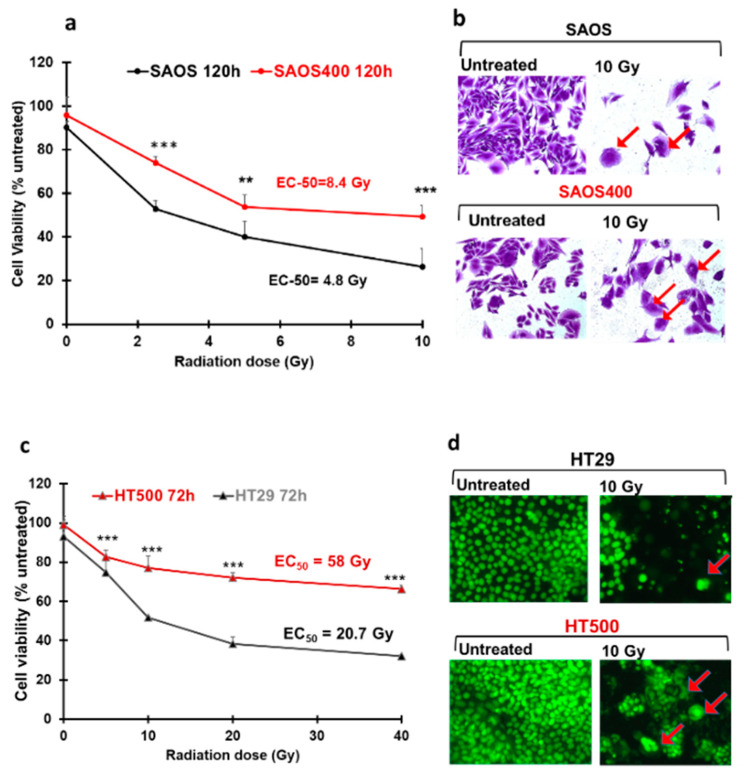
Figure 2.
Radio-resistance of SAOS400 and HT500 cells compared to their parental cell lines. Changes in cell viability after increasing doses of γ-rays in SAOS vs. SAOS400 (panel a) and HT29 vs. HT500 cells (panel c). Data represent the mean of three independent experiments (±SD). Symbols indicate significance: ** p < 0.01 or *** p < 0.001 of the parental cells compared to the radio-resistant sub-population (Student’s t-test). The calculated EC50s are reported as inserts within the graphs. Photographs (400x magnification) show representative fields of untreated and SAOS or SAOS400 cells after IR (10 Gy), stained with Crystal Violet dye (panel b) or untreated and IR-treated (10 Gy) HT29 or HT500 cells stained with CyQuant dye (panel d).

