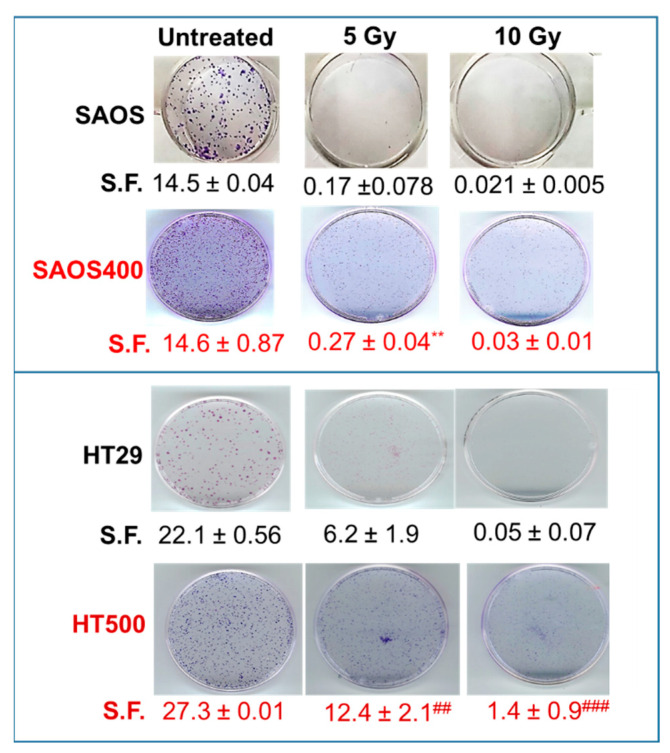
Figure 3.
Colony-forming assay. Representative images are reported comparing SAOS and HT29 cells with their respective radio-resistant counterparts, SAOS400 and HT500 cells. Numbers below each row of panels indicate the means of counted colonies ± SD expressed as S.F (Surviving Fractions) from two independent experiments. Symbols indicate significance with ** p < 0.01 with respect to SAOS cells and ## p < 0.01 and ### p < 0.001 with respect to HT29 cells (Student’s t-test).

