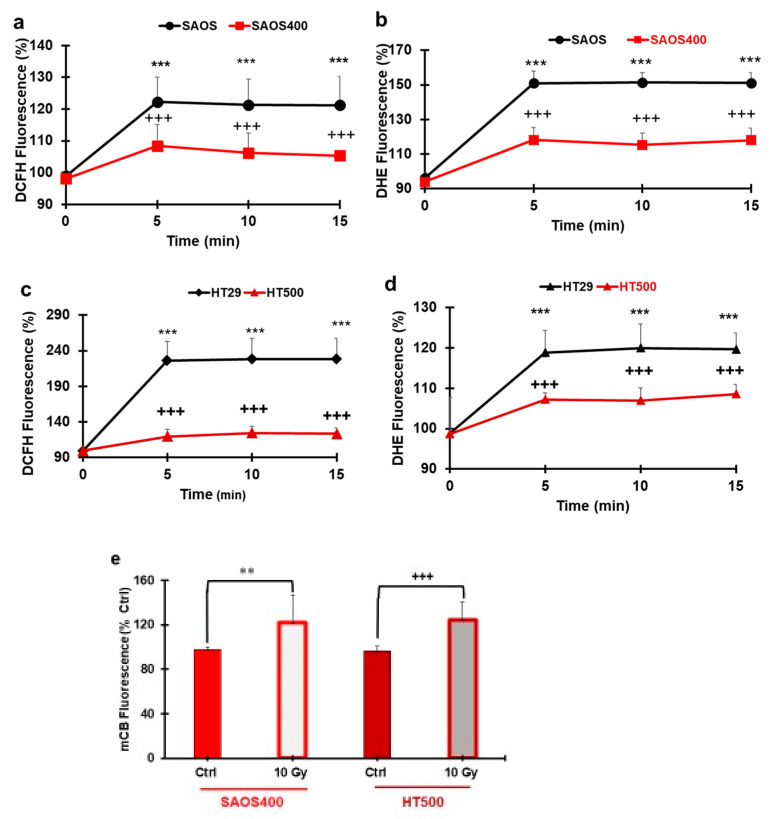
Figure 5.
ROS and GSH production in SAOS400 and HT500 cells. SAOS/SAOS400 and HT29/HT500 (panels a and c) cells were pre-incubated with H2O2 probe (CM-DCFDA) or O2− probe (DHE) (panels b and d), washed, and irradiated (10 Gy). Fluorescence was measured in the 5–15 min time range. Data reported are the mean ± SD of three independent experiments in quadruplicate. Symbols indicate significance after ANOVA analysis for multiple comparisons at different time points: *** p ≤ 0.001 of SAOS400 and HT500 cells vs. their parental cell lines; +++ p ≤ 0.001, indicate significance of SAOS400 and HT500 cells at times 5–15 min vs. time 0 min. In panel (e), the GSH levels in SAOS400 and HT500 cells after 10 Gy for 2 h are reported. Cells were incubated with a GSH intracellular probe (mCB), as described in the Methods section. Bar graphs represent the mean ± SD of three independent experiments in quadruplicate. Symbols indicate significance: ** p < 0.01 untreated SAOS400 cells vs. irradiated; +++ p < 0.001 untreated HT500 vs. irradiated.

