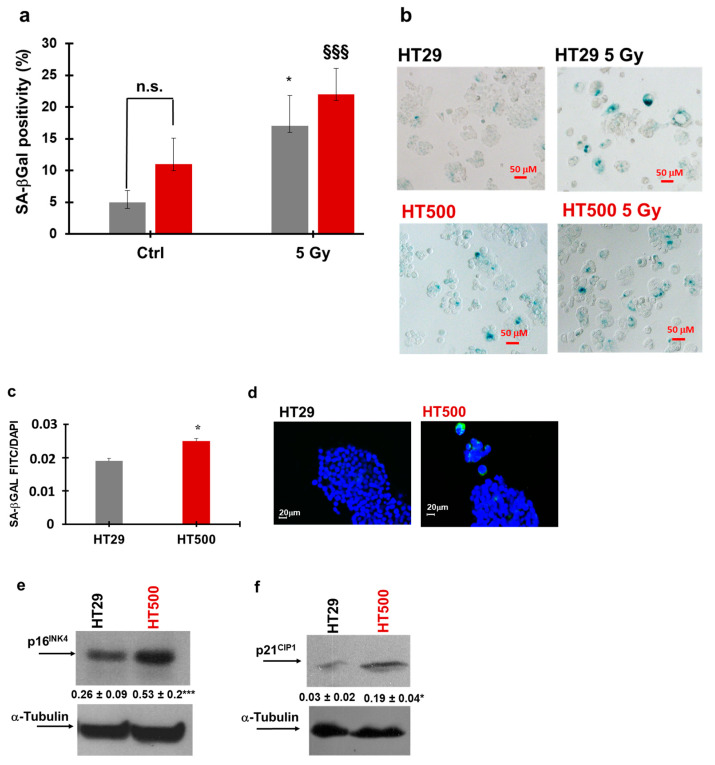
Figure 7.
Senescence measurements in HT29 and HT500 cell lines. SA-βGal staining in HT29 and HT500 cells before and after irradiation (5 Gy) were quantified (panel a) and microscopically visualized (panel b). The results of a different protocol that employed C12FDG staining were also quantified (panel c), and representative images were reproduced (d). Bar graphs represent the mean ± SD of two independent experiments. Symbols indicate significance: * p < 0.05 for untreated HT29 vs. irradiated HT29 (grey bars); §§§ p ≤ 0.001 for HT500 before and after irradiation (dark red bars) One-way ANOVA with Bonferroni’s multiple comparisons test was used. The immunoblots report the basal expression of p16INK4 (panel e) and p21CIP1 (panel f) in HT29 and HT500 cells. Numbers between panels indicate densitometric analysis ± SD of two independent experiments. Symbols indicate significance with * p < 0.05 and *** p < 0.001 (t-test Student).

