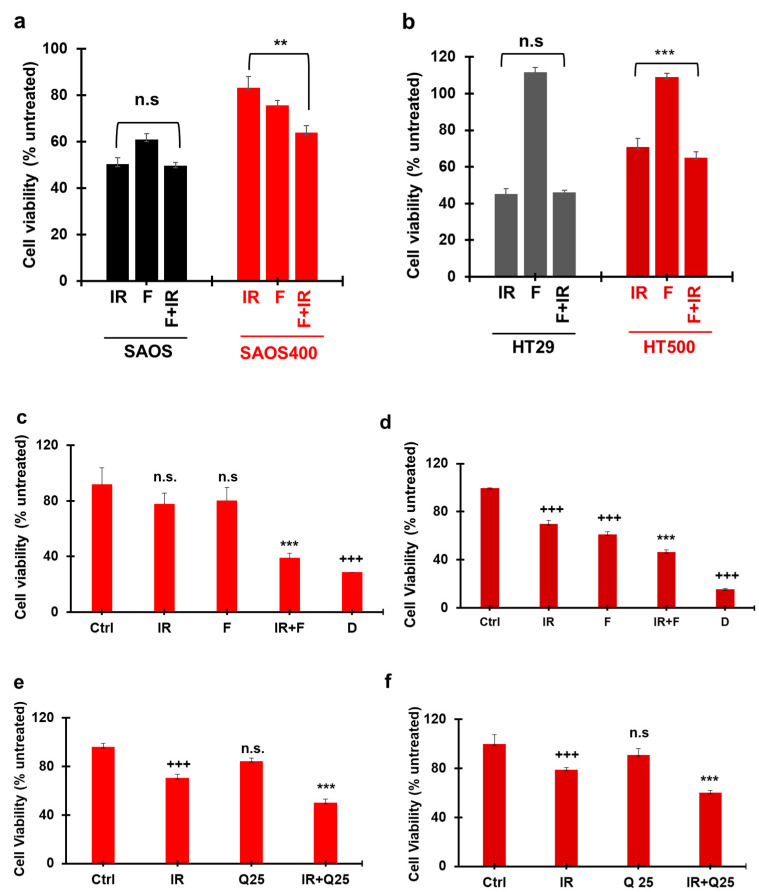
Figure 8.
Senolytic effects of fisetin and quercetin in irradiated SAOS400 and HT500 cell lines. SAOS and SAOS400 cells (panel a) and HT29 and HT500 cells (panel b) were pre-irradiated (10 Gy), cultured for 72 h, and subsequently were incubated for an additional 72 h in the presence of 20 μM F. CyQuant assay was used to quantify cell viability expressed as a percentage of untreated cells. Bar graphs represent mean ± S.D of two independent experiments. Symbols indicate significance: p ≤ 0.01 ** p ≤ 0.001 *** with respect to F and IR cells. n.s. = no statistical significance between the combined treatment, F + IR, vs. IR mono-treatment in both SAOS and HT29 parental cell lines. Radio-resistant SAOS400 (panel c) and HT500 (panel d) cells were pre-irradiated and then directly treated for 96 h with 40 μM F. CyQuant assay was used to quantify cell viability expressed as a percentage of untreated cells. Bar graphs represent mean ± S.D of two independent experiments. Symbols indicate significance: +++ p ≤ 0.001 vs. untreated (Ctrl); *** p ≤ 0.001 vs. F and IR; n.s. not significant vs. untreated (Ctrl). Daunorubicin (D; 0.04 mg/mL) was used as positive control. In panel (e) and (f), SAOS400 and HT500 cells were pre-irradiated (5 Gy) and cultured for 72 h; subsequently, they were incubated for an additional 48 h with 25 μM Q or vehicle DMSO (0.1%). Crystal Violet assay was used to quantify cell viability that was expressed as a percentage of DMSO-treated cells. The bar graph represents mean ± S.D. Symbols indicate significance: +++ p ≤ 0.01 vs. untreated, *** p < 0.001 vs. Q/IR; n.s. not significant vs. untreated (Ctrl). One-way ANOVA with Bonferroni’s multiple comparisons test was used in these experiments.

