Figure 9.
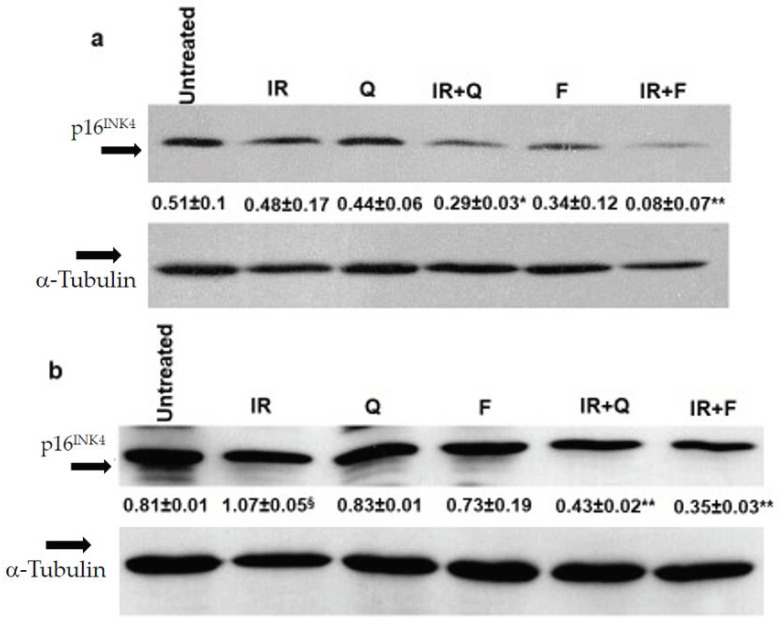
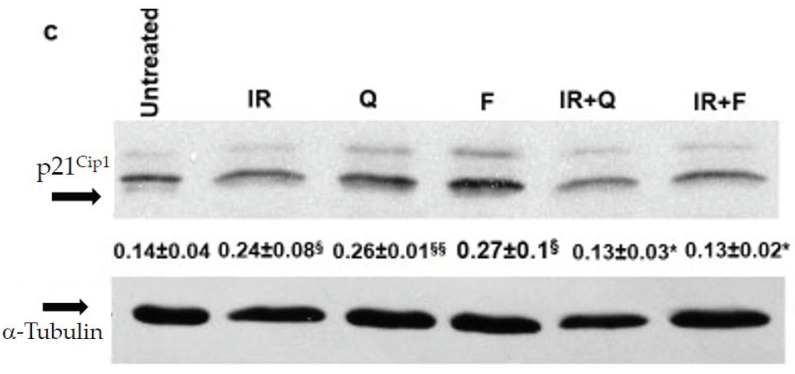
Changes in senescence markers following senolytic treatments in SAOS400 and HT500 cell lines. Immunoblot analysis of p16INK4 expression in SAOS400 cells (panel a) pre-irradiated (10 Gy) and treated with F (40 μM) or Q (40 μM) for 48 h. Densitometric analysis (numbers between panels) was obtained normalizing the expression of p16INK4 with α−tubulin and quantified as described in the Methods section. * p < 0.05 vs. Q and IR; ** p < 0.01 vs. F and IR. Immunoblots of p16INK4 (panel b) and p21CIP1 (panel c) expressions in HT500 cells pre-irradiated (10 Gy) and treated with 40 μM F or 40 μM Q for 72 h. Densitometric analyses (numbers between panels) were obtained normalizing the expressions of p21CIP1 and p16INK4 with α-tubulin and quantified as described Methods section. § p < 0.05 vs. untreated; §§ p < 0.01 vs. untreated; * p < 0.05, ** p < 0.01 vs. F plus Q and IR.


