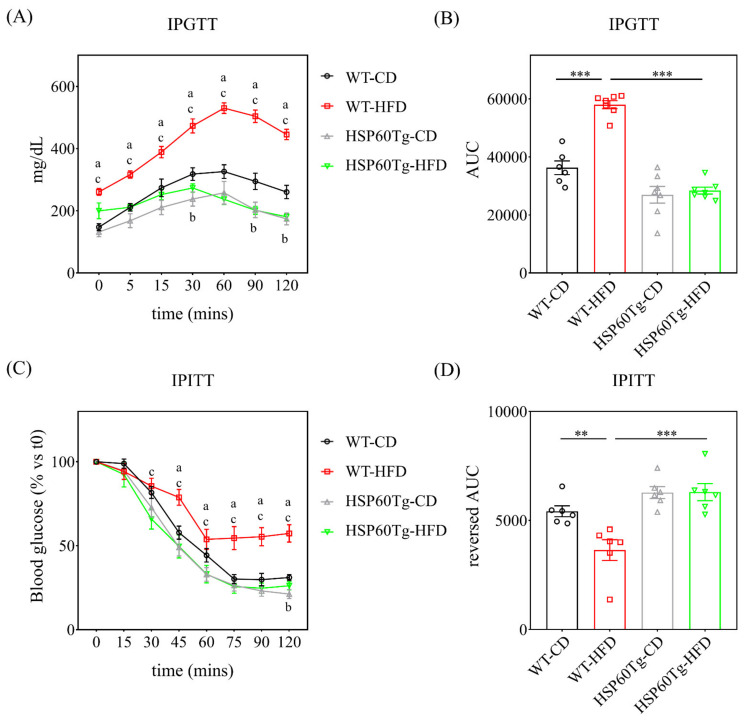
Figure 1.
Comparison of IPGTT and IPITT among the different groups. Both tests were performed on mice at the end of the 6-month period of CD or HFD. (A) IPGTT was analyzed by the corresponding (B) AUC obtained from changes in plasma glucose. (C) IPITT was analyzed by corresponding with the reverse (D) AUC data obtained. Results were obtained from six to seven independent experiments and data expressed as the mean ± standard error. a p < 0.05 WT-CD versus WT-HFD; b p < 0.05 WT-CD versus HSP60Tg-CD; c p < 0.05 WT-HFD versus HSP60Tg-HFD. Intraperitoneal glucose tolerance test (IPGTT) and insulin tolerance test (ITT); chow diet (CD); high-fat diet (HFD); area under curve (AUC); transgenic heat shock protein 60 (HSP60Tg); wild type (WT). ** indicates p < 0.01, *** indicates p < 0.001.

