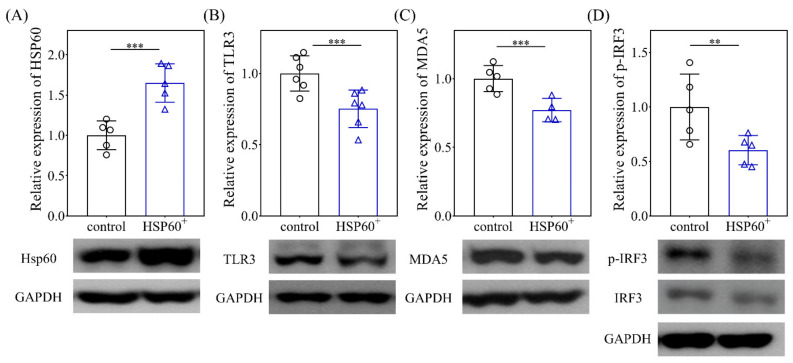
Figure 6.
Analyses of HSP60 (A), TLR3 (B), MDA5 (C), and p-IRF3 (D) on the 10th culture day of HepG2 after treatment with a HSP60 overexpression vector for 24 h. Data are expressed as the mean ± SE of the four to six samples per group. ** p < 0.01 and *** p < 0.001 between the indicated groups. TLR3, toll-like receptor 3; MDA5, melanoma differentiation-associated gene 5; P-IRF3, phosphorylated-interferon regulatory factor 3; GAPDH, glyceraldehyde 3-phosphate dehydrogenase.

