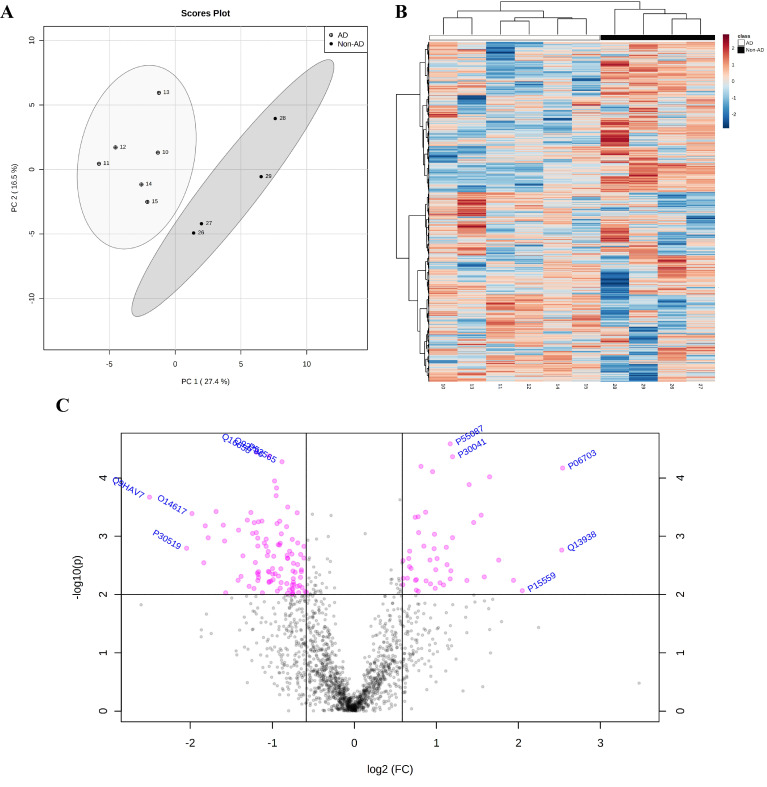
Figure 5.
Prominent downregulated proteins in AD samples. Principal component analysis (PCA) revealed two-well defined groups of AD and non-AD samples (A). The cluster analysis data visualized by heatmap reveal the differential expression of 1635 proteins between groups (B). The volcano plot shows 47 up- and 102 downregulated proteins among a total of 1635 analyzed proteins (C) (FC > 1.5, p value < 0.01). Statistical analysis was performed with MetaboAnalyst 5.0.

