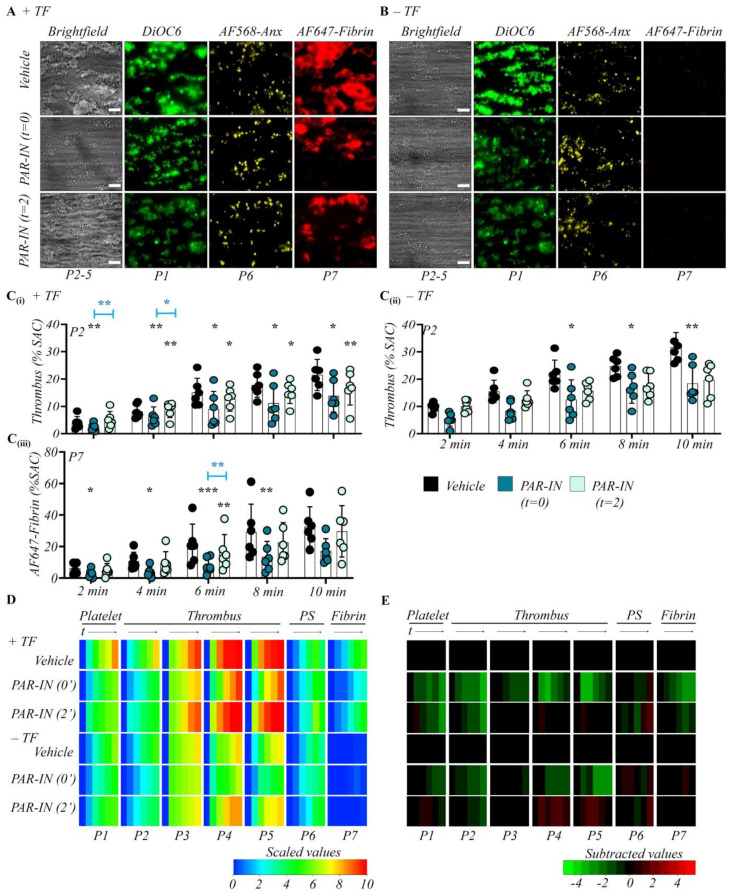
Figure 2.
Involvement of platelet thrombin receptors PAR1 and PAR4 in thrombus formation. Citrated whole-blood samples from healthy subjects (n = 6) were supplemented with fluorescent labels and perfused over microspots of collagen and collagen/TF, as shown in Figure 1. Where indicated (PAR-IN), perfusion was switched from control blood to blood preincubated with vehicle or a mix of atopaxar (PAR1 inhibitor, 2 µM, f.c.) and BMS-986120 (PAR4 inhibitor, 1 µM, f.c.). Control blood runs were carried out with vehicle solution. Thrombus formation on both microspots was analyzed from captured images for parameters P1-7, as in Figure 1. (A,B) Representative 10 min end stage images of vehicle control condition; early PAR-IN (mix from start); later PAR-IN (mix from 2 min). Images were taken from microspots in the absence (A) or presence (B) of TF. Quantitative analysis from ± TF surfaces of parameter P2: thrombus coverage (Ci,Cii), and P7: fibrin deposition (Ciii). Means ± SD, * p < 0.05, ** p < 0.01, *** p < 0.001 vs. indicated group (t-test). (D) Heatmap of univariate scaled time-dependent values of P1–7 for indicated surfaces and conditions. (E) Subtracted heatmap of scaled parameters versus collagen and collagen/TF control runs, further as for Figure 1. For additional data, see Figure S2.

