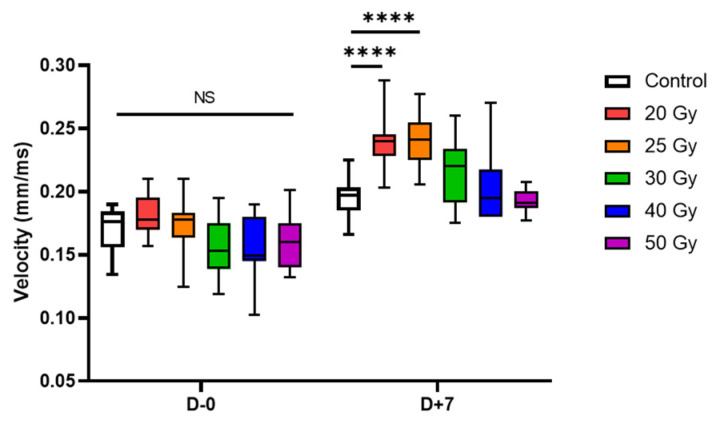
Figure 7.
Box-and-whisker plots of conduction velocity on days 0 and 7 after high-dose irradiation (nwells = 20–24). Adjusted p-values were determined by one-way analysis of variance followed by Dunnett’s multiple comparison test compared with the control group: **** p < 0.0001. Abbreviation: NS, not significant.

