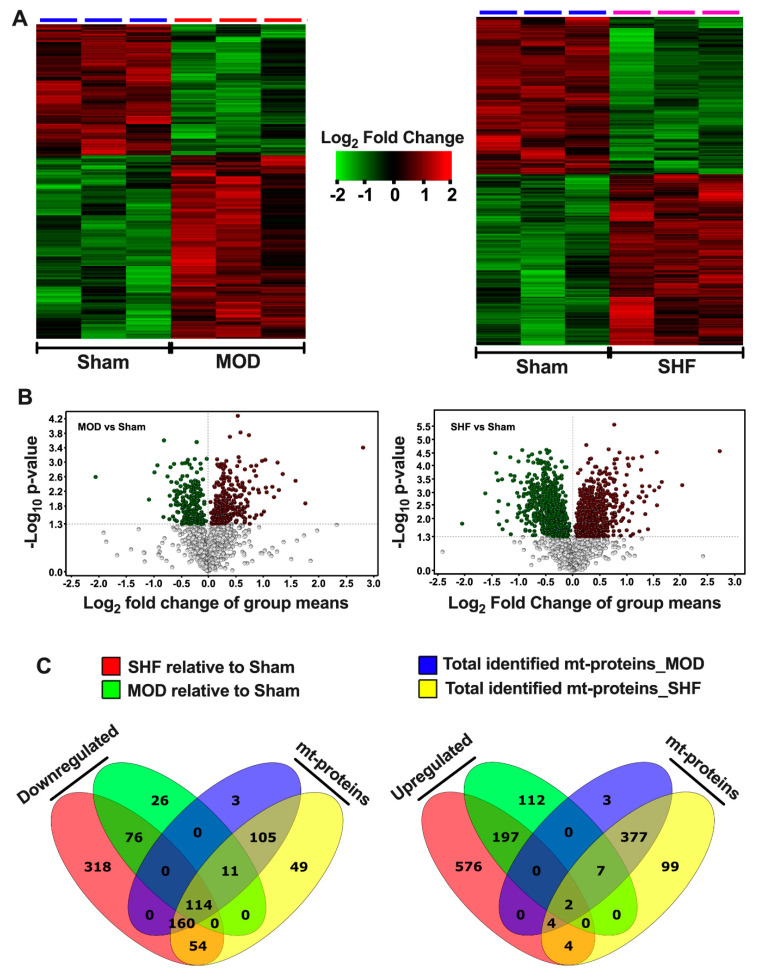
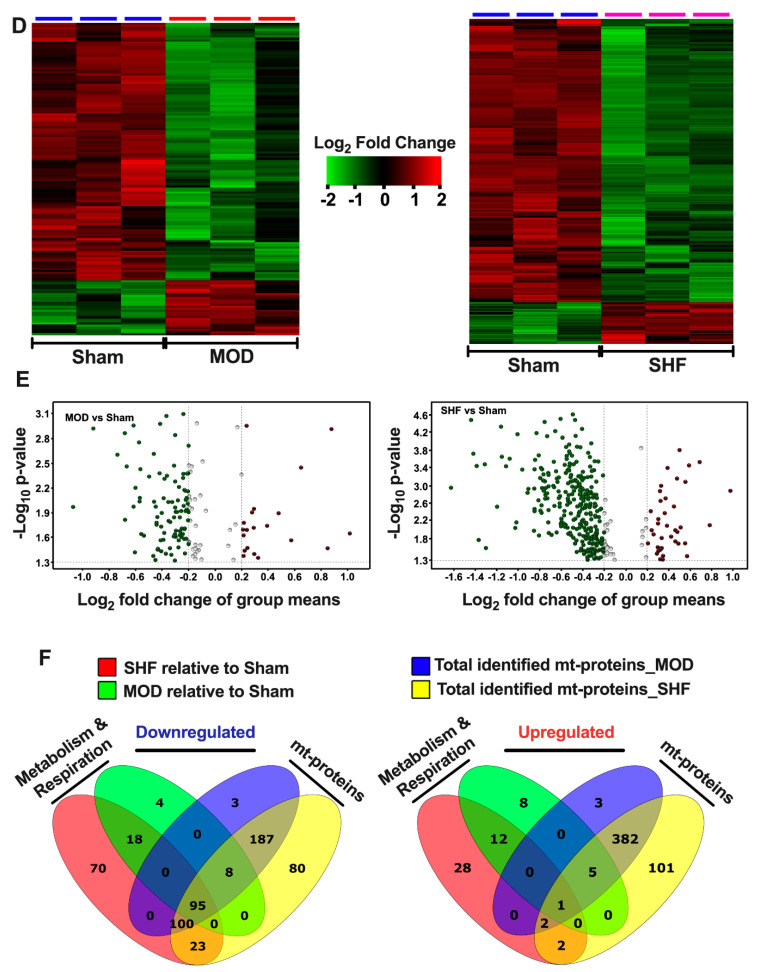
Figure 1.
Visualization of the MOD and SHF proteomic datasets. (A) Heat maps showing differential log2 fold change in expression of identified proteins that changed in MOD vs. Sham (left), and in SHF vs. Sham (right). The same Sham biological samples were used as a reference for both TMT-label proteomic runs; n = 3 biological samples per group. (B) Volcano plots of the identified proteins that changed in MOD (left) and SHF (right) groups vs. Sham. The x-axis displays the log2 fold change in group means for down-regulated proteins (green) and up-regulated proteins (red) in MOD or SHF vs. Sham. The y-axis displays the -Log10 p-value of identified proteins that were statistically significant in MOD (left) and SHF (right) vs. Sham. A -Log10 p-value cutoff of 1.3 (p = 0.05) and higher was considered significant. (C) Venn diagrams showing the number of identified proteins that changed in SHF (red) and MOD (green) groups, divided into those whose relative expression decreased (left) or increased (right) vs. Sham. The blue and yellow diagrams show the total number of identified mitochondrial (mt) proteins in the MOD and SHF proteomic runs, respectively. (D) Heat maps showing differential log2 fold change in expression of proteins related to metabolism and respiration that changed in MOD vs. Sham (left), and in SHF vs. Sham (right). (E) Volcano plots showing the log2 fold change in group means (x-axis) and the corresponding -Log10 p-value on the y-axis of the identified proteins presented in (D). (F) Venn diagrams showing the total number of identified proteins related to metabolism and respiration that decreased (left) or increased (right) in MOD and SHF groups, green and red diagrams, respectively. They also show how many of those were mt proteins (intersection of green and blue diagrams for MOD and red and yellow diagrams for SHF) vs. non-mitochondrial proteins (numbers that fall outside the intersection of green and blue diagrams for MOD and red and yellow diagrams for SHF).


