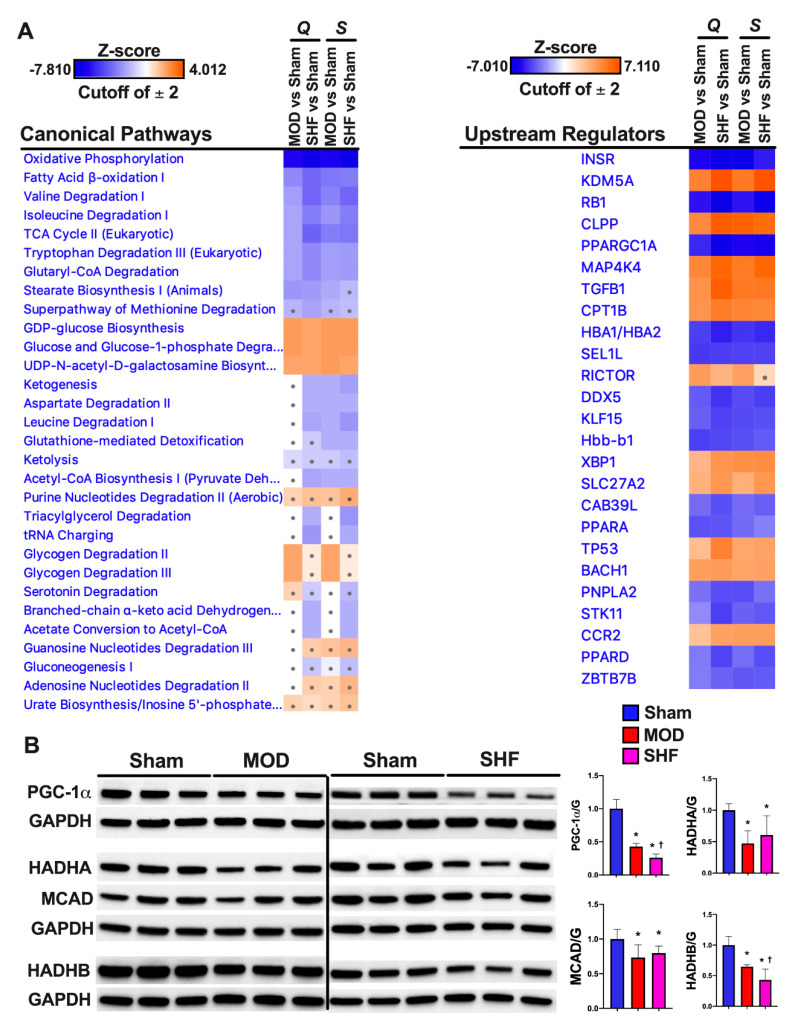
Figure 2.
Top-ranked Canonical Pathways related to metabolism and Upstream Regulators, resulting from IPA’s ‘Comparison Analyses’ of the experimental groups. (A) ‘Core Analyses’ of the statistically analyzed proteomic datasets, by both Qlucore (Q) and Scaffold (S) bioinformatics software, were performed in IPA for each of the two-group comparisons, i.e., MOD vs. Sham and SHF vs. Sham, with a cutoff p-value < 0.05. Analyzed datasets were then subsequently compared with each other in IPA’s ‘Comparison Analyses’ function to yield the most enriched Canonical Pathways (left) related to metabolism and Upstream Regulators (right) that were shared among the two-group comparisons. The respective z-score-based heat maps indicate shared Canonical Pathways and Upstream Regulators that were up-regulated/activated or down-regulated/inhibited in the two-group comparisons, with orange and blue color intensities representing the z-score-based extent of up-regulation/activation or down-regulation/inhibition, respectively. Canonical Pathways and Upstream Regulators with a z-score outside the cutoff value are represented by a dot on the heat map. (B) Western blot in left ventricular myocardium showing the expression of the peroxisome proliferator-activated receptor gamma coactivator 1-alpha (PGC-1a), and proteins involved in mt fatty acid β-oxidation (HADHA, MCAD and HADHB), * p < 0.05 vs. Sham and † p < 0.05 vs. MOD.

