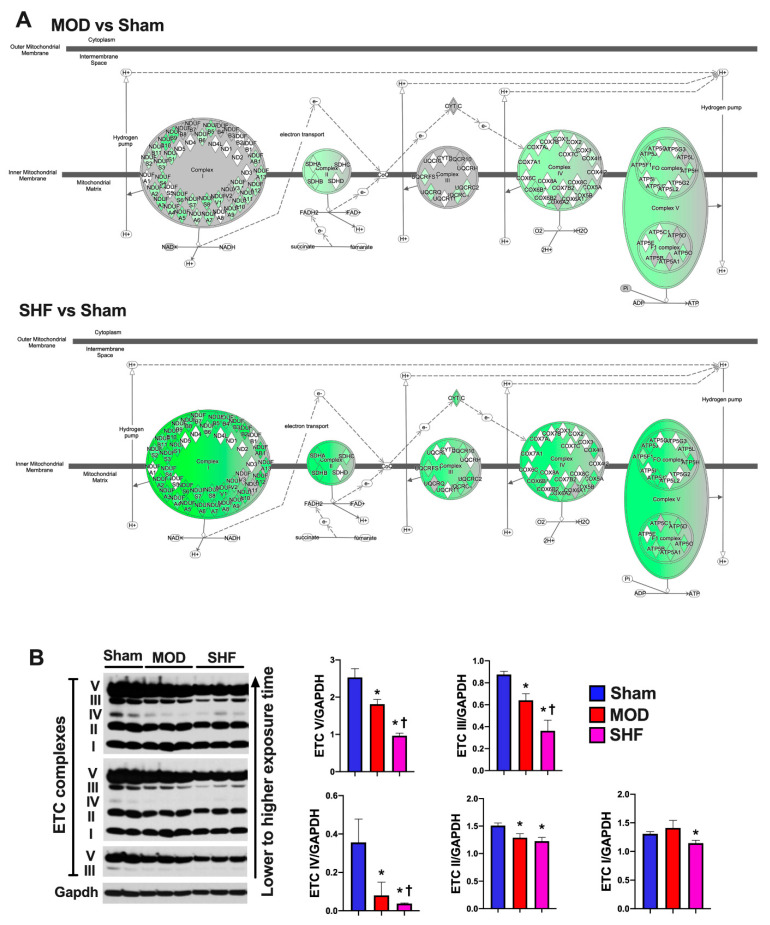
Figure 3.
Oxidative phosphorylation in MOD and SHF. (A) Oxidative phosphorylation (OXPHOS) network of the electron transport chain (ETC) complexes I-IV transport system and ATP synthase are presented in MOD vs. Sham (upper panel) and SHF vs. Sham (lower panel). The network highlights mt OXPHOS proteins in each ETC complex that were downregulated (green) vs. Sham, were unchanged (grey) vs. Sham, or were not identified (white) in the MOD and SHF proteomic runs. The darker the green color, the higher the degree of downregulation. (B) Expression of the ETC complexes I-IV and ATP synthase (complex V) in MOD and SHF by immunoblotting, * p < 0.05 vs. Sham and † p < 0.05 vs. MOD.

