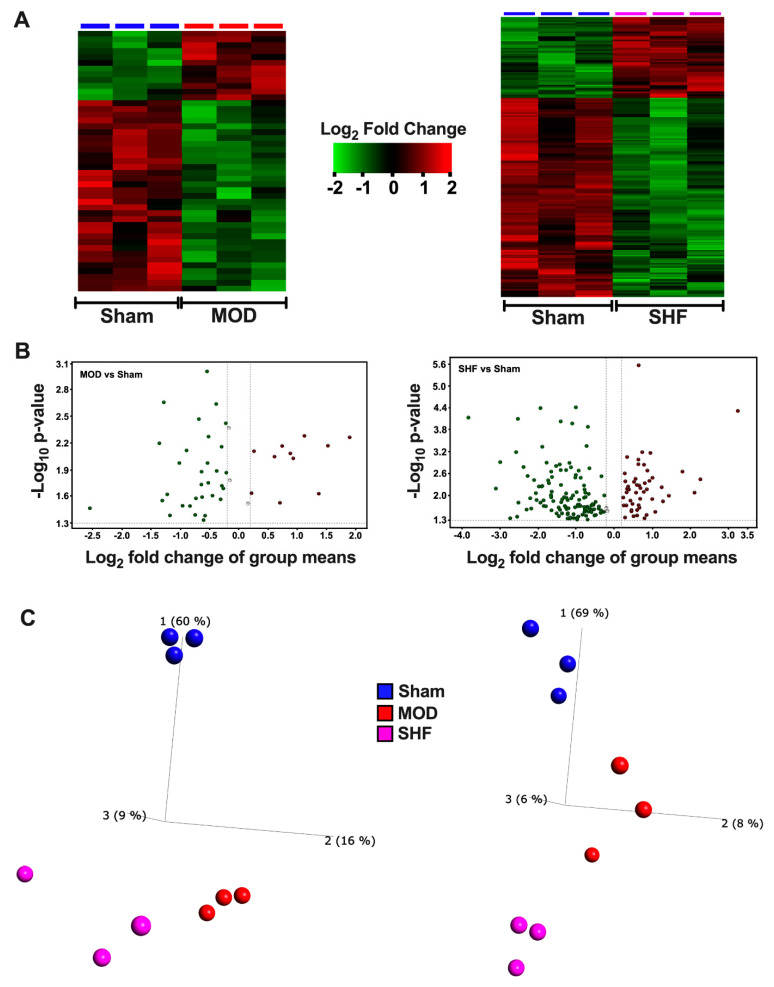
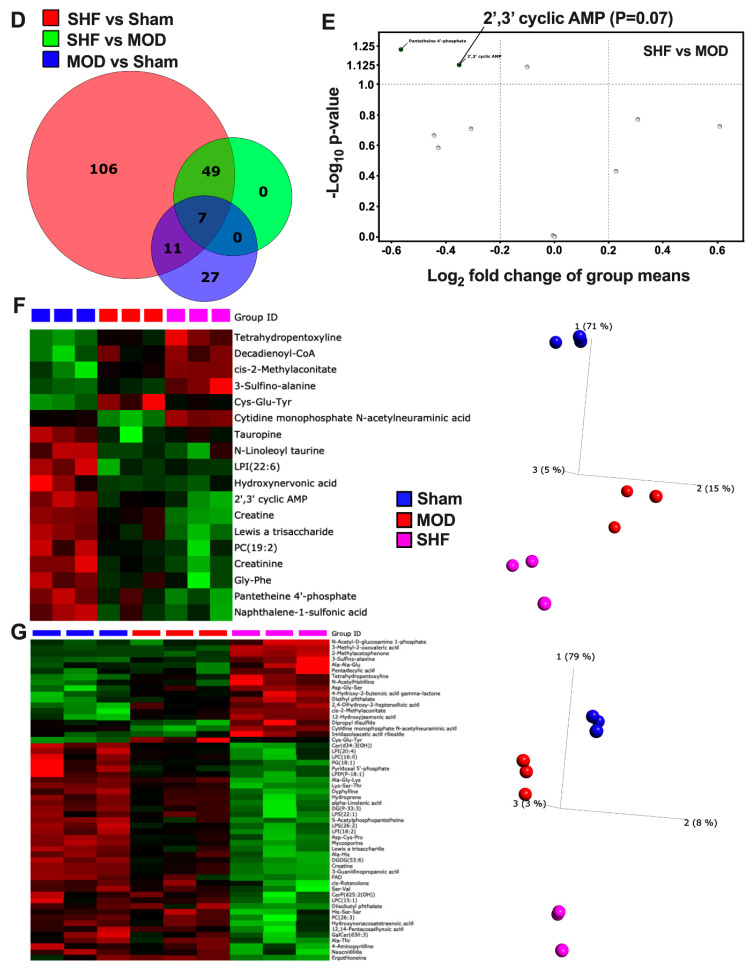
Figure 4.
Visualization of the non-targeted metabolomics dataset in Sham, MOD, and SHF groups. (A) Heat maps showing differential change in log2 fold expression of metabolites that changed in MOD vs. Sham (left), and in SHF vs. Sham (right); n = 3 samples per group. (B) Volcano plots showing the log2 fold change in group means, on the x-axis, and the corresponding -Log10 (p-value), on the y-axis, for the metabolites that were downregulated (green) or upregulated (red) in MOD (left) and SHF (right) vs. Sham. A -Log10 (p-value) cutoff of 1.3 and higher was considered significant. (C) PCA plots showing the variance in biological samples within and between the Sham, MOD, and SHF groups for the metabolites that changed in MOD (left) and SHF (right) vs. Sham. (D) Venn diagram showing the number of metabolites that changed in SHF (red) and MOD (blue) vs. Sham and those that changed in SHF vs. MOD (green). (E) Volcano plot of the 11 common identified metabolites that changed in MOD and SHF vs. Sham (intersection of red and blue diagrams excluding the green diagram). Of those, there was a trend for further downregulation of pantetheine 4′-phosphate and 2′,3′ cyclic AMP in SHF compared with MOD. (F) Heat map and PCA plot for the 17 common metabolites that changed in MOD and SHF vs. Sham. (G) Heat map and PCA plot for the metabolites that changed in SHF vs. Sham and MOD groups. Heat maps and PCA plots in both F and G show the differential log2 fold change in expression in Sham, MOD, and SHF groups and the variance in biological samples, respectively, for the metabolites presented in (F) and (G).


