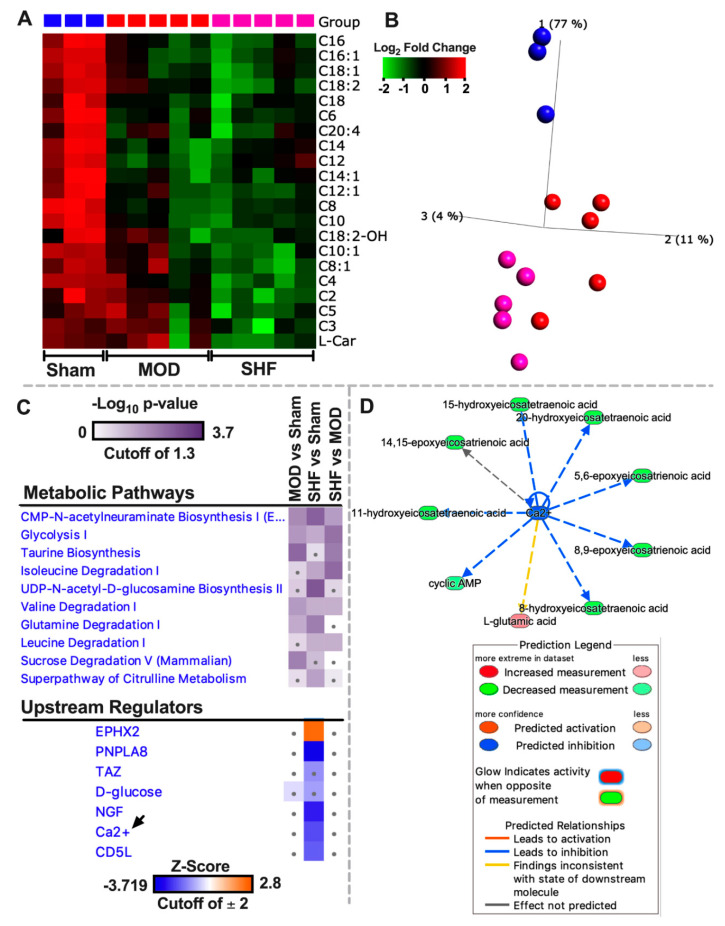
Figure 5.
Fatty-acyl-carnitine abundance, top-ranked Metabolic Pathways, and Upstream Regulators in the MOD and SHF. (A,B) Heat map and PCA plot showing the differential log2 fold change in expression and variance of biological samples for fatty-acyl-carnitines that changed in MOD and SHF groups vs. Sham. (C) ‘Core Analyses’ of the statistically analyzed dataset, by Qlucore bioinformatics software, was performed in IPA for each of the two-group comparisons and then were compared in IPA’s ‘Comparison Analyses’ function. The generated heat maps show the most enriched Metabolic Pathways (upper panel) by p-value and Upstream Regulators (lower panel) by z-score. (D) Mechanistic network showing connection between calcium, as a second messenger, and metabolites implicated in calcium cycling and homeostasis. Please refer to prediction legend for details.

