Figure 7.
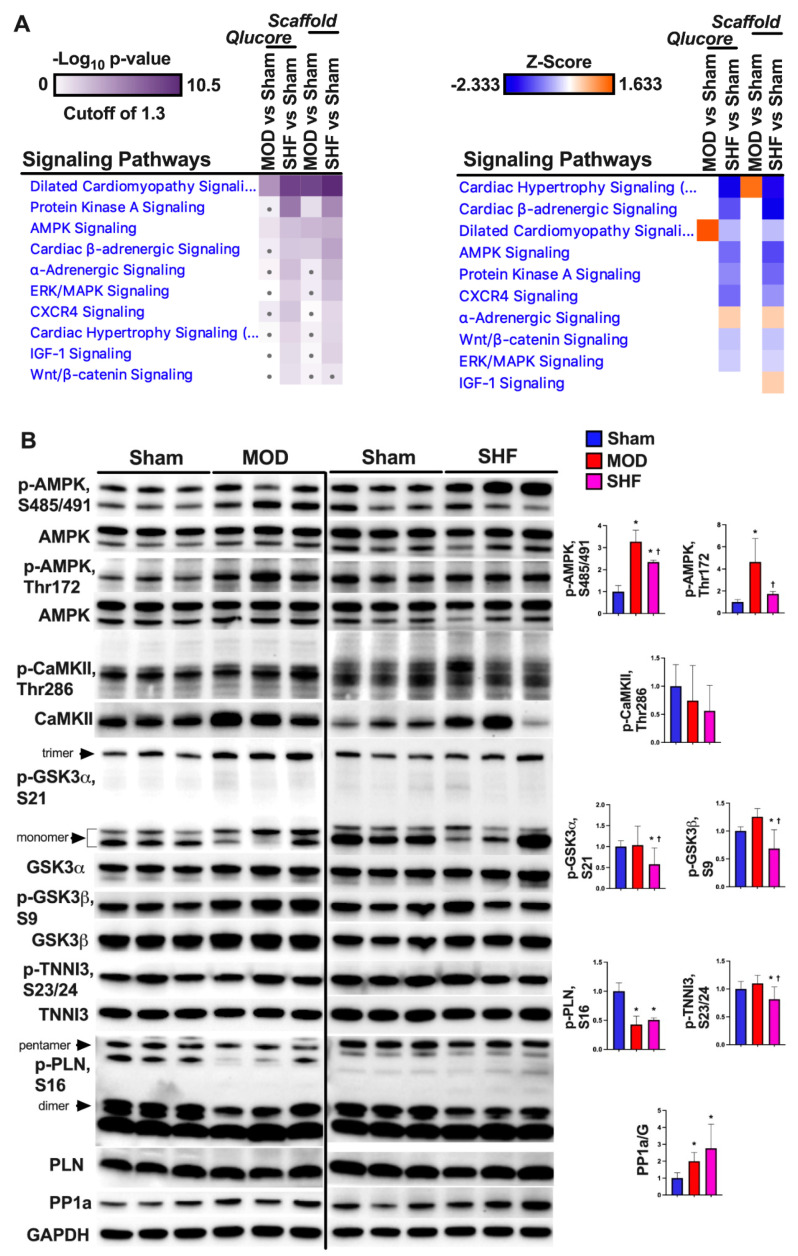
Top-ranked Signaling Pathways in the MOD and SHF groups. (A) ‘Core Analyses’ of the statistically analyzed p-proteomic datasets by Qlucore and Scaffold bioinformatics software was performed in IPA for each of the two-group comparisons (MOD vs. Sham and SHF vs. Sham), which were then compared in IPA’s ‘Comparison Analyses’ function to yield the most enriched signaling Pathways that were shared among the two-group comparisons. The generated heat maps are presented by p-value (left) and by z-score (right). (B) Western blot showing post-translational modification of AMPK and PKA downstream protein targets as well as protein phosphatase 1 (PP1) expression in the MOD and SHF groups, * p < 0.05 vs. Sham and † p < 0.05 vs. MOD.

