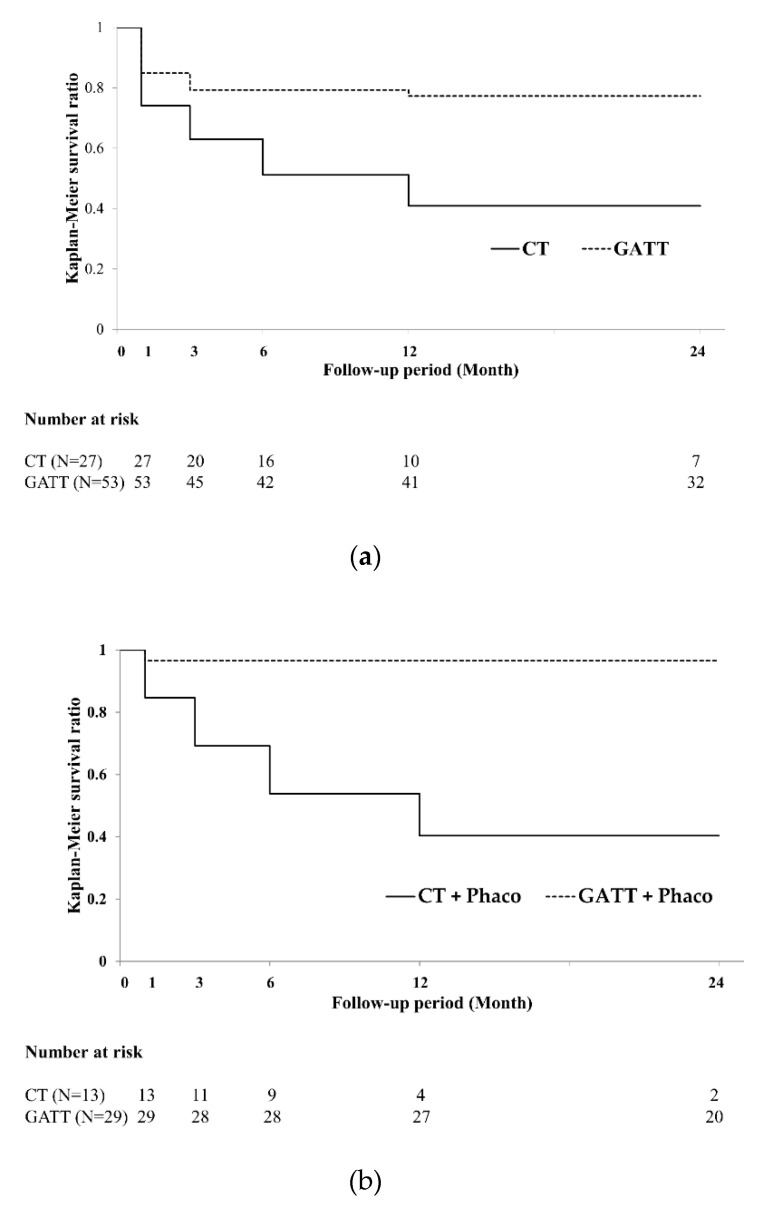
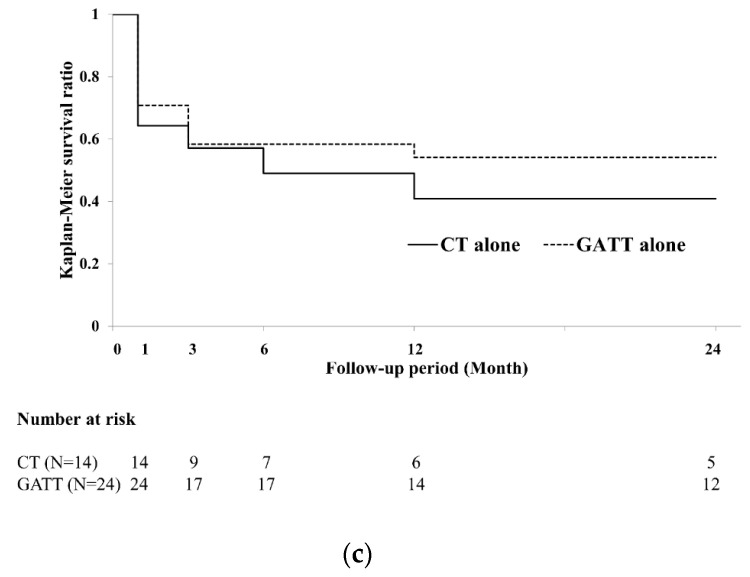
Figure 1.
Kaplan–Meier survival curves of surgical success in the CT (solid line) and GATT (dotted line) groups. (a) Survival curve of all eyes in the CT and GATT group. Differences between the two groups were significant using the log-rank test (p < 0.005). (b) Survival curve in eyes that underwent CT or GATT with phacoemulsification. Differences between the two groups were statistically significant using the log-rank test (p < 0.001). (c) Survival curve in eyes that underwent CT or GATT without phacoemulsification. Differences between the two groups were not statistically significant using the log-rank test (p = 0.55). CT, conventional trabeculotomy; GATT, gonioscopy-assisted transluminal trabeculotomy.


