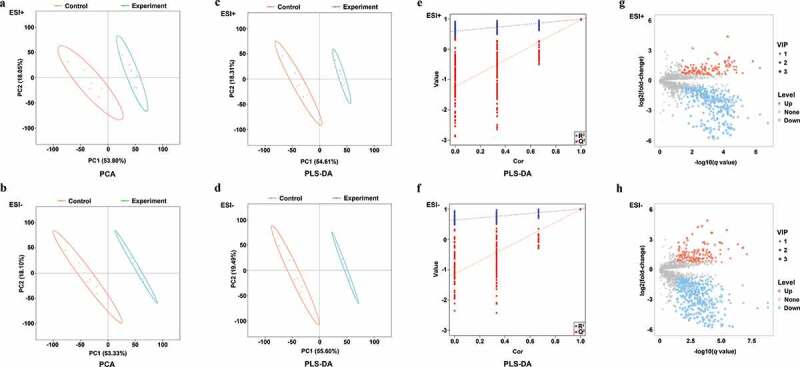
Figure 2.

PCA, PLS-DA plots, and differentially abundant ions identified in ESI+ and ESI- modes for treatment and control group samples. (a-b) PCA plots for ESI+ and ESI- modes; (c-d) PLS-DA plots for ESI+ and ESI- modes; (e-f) Validation plots were obtained from 200 permutation tests in (c) ESI+ (R2 = 0.993 and Q2 = 0.970) and (d) ESI- (R2 = 0.997 and Q2 = 0.976) modes; (g) Differentially abundant ions identified in the ESI+ mode; (h) Differentially abundant ions identified in the ESI- mode.
