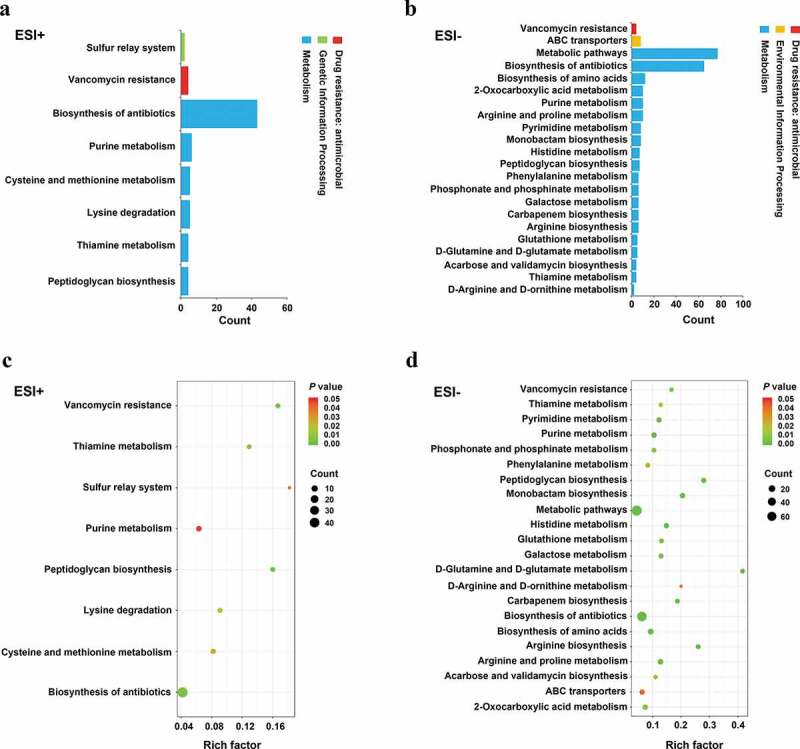
Figure 3.

Pathways that were enriched for differentially abundant metabolites. (a-b) The number of involved metabolites (p< 0.05) in a specific pathway; (c-d) Enriched pathways for these metabolites (p < 0.05). Lower p values and higher pathway impact factors indicate a more significant pathway impact.
