
Figure 8.
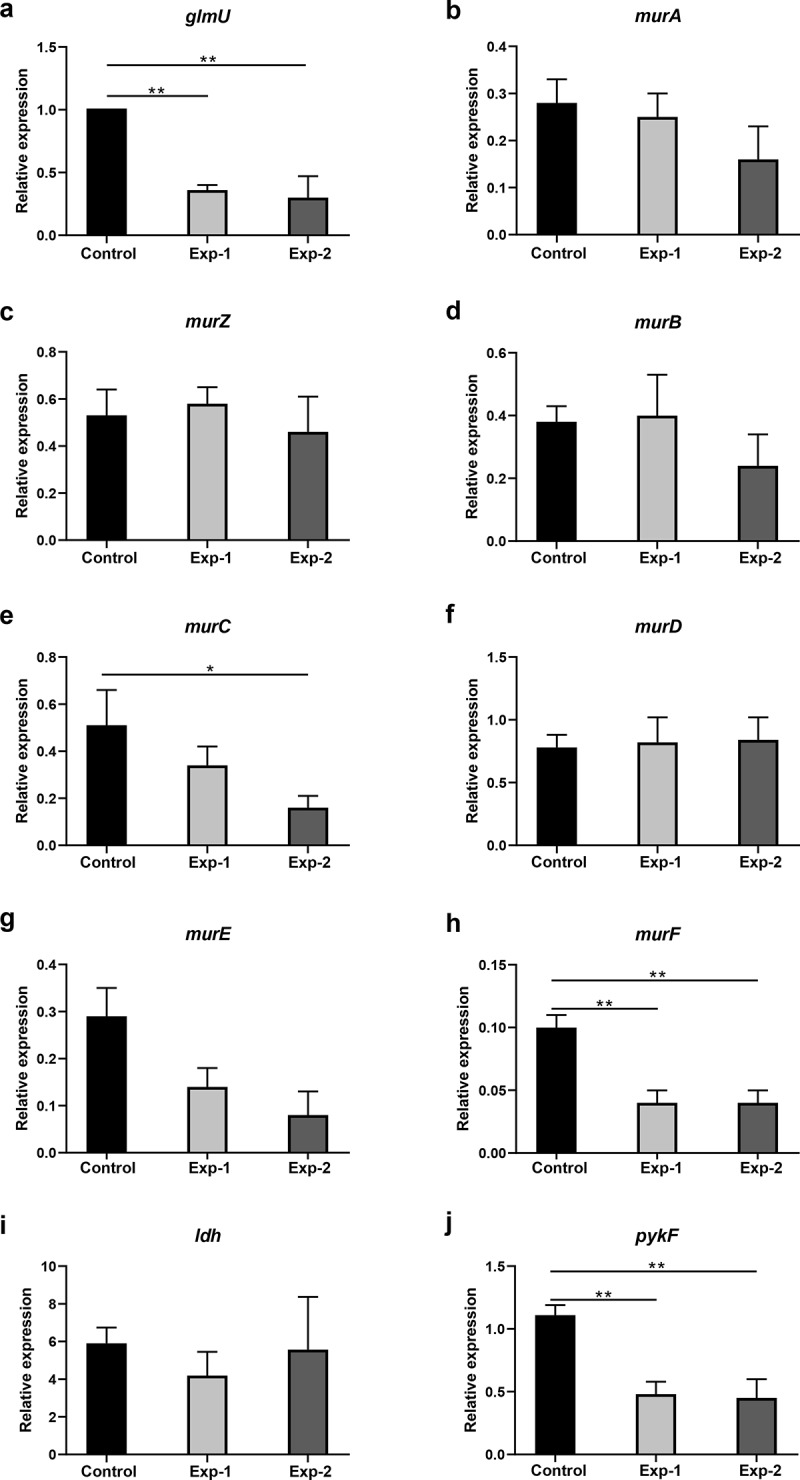
Gene expression analysis related to differentially expressed metabolites in pathways listed in Figures 4 and 6. Control and Exp-1 represent the 24 h biofilm model without and with arginine intervention, respectively. Exp-2 represents the biofilm model treated with arginine a second time (20 h). The expression level of glmU in the control was defined as 1. *p < 0.05; **p < 0.01.