Figure 4.
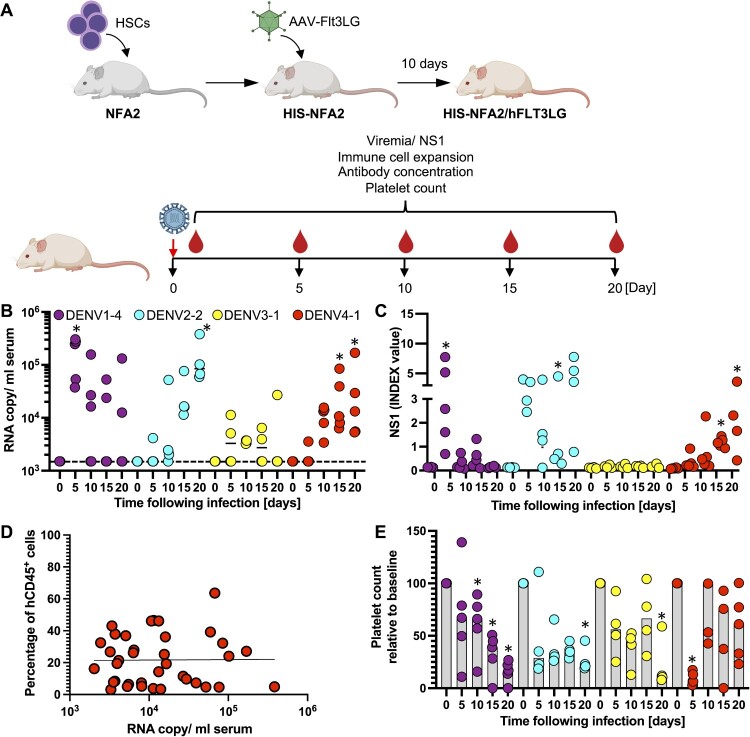
. CPER-derived DENV of all 4 serotypes establish infection in humanized mice. (A) Schematic overview for the generation of HIS-NFA2/hFLT3Lg mice utilized in the in vivo DENV experiments created with BioRender.com. (B) Four cohorts of mice were inoculated intravenously (i.v.) with 105 FFU of either DENV1 (n = 5, purple), DENV2 (n = 4, cyan), DENV3 (n = 4, yellow), or DENV4 (n = 5, red). Mice were bled at indicated timepoints post-infection, and viral RNA was extracted from plasma and quantified by RT-qPCR. Results are presented as copies of viral RNA per milliliter of plasma measured until 20 days post-infection. The dashed line represents the threshold for viral RNA detection (1,500 RNA copies/ml). Each symbol represents one mouse. (C) NS1 antigen in plasma was quantified by ELISA. (D) Correlation between chimerism (number of human CD45+ cells divided by total CD45+ cells) and viremia. Blood samples from DENV1-4 infected HIS-NFA2/hFLT3LG mice were collected at days 5, 10, 15, 20. Samples were stained for hCD45+ and mCD45+ to determine the human hematopoietic chimerism and viral RNA copies were quantified in serum by RT-qPCR. Symbols represent individual mouse, and the straight lines are the linear regression plotted between chimerism and viral RNA copy numbers (Pearson’s r values of 0.000009725). (E) Human platelet counts were assessed longitudinally over the course of 20 days after DENV-infection. Mice from each of the 4 experimental cohorts were bled at the indicated timepoints. Samples were stained for hCD41a+ to assess the absolute cell count per microliter of blood. The numbers are normalized on the day of DENV- infection (baseline). The numbers are normalized on the day of DENV- infection (baseline). Statistical significance was assessed using Friedman with Dunnett’s test (B, C, E) and is indicated by asterisks (*, compared between data at day 0 or baseline).

