Fig. 5.

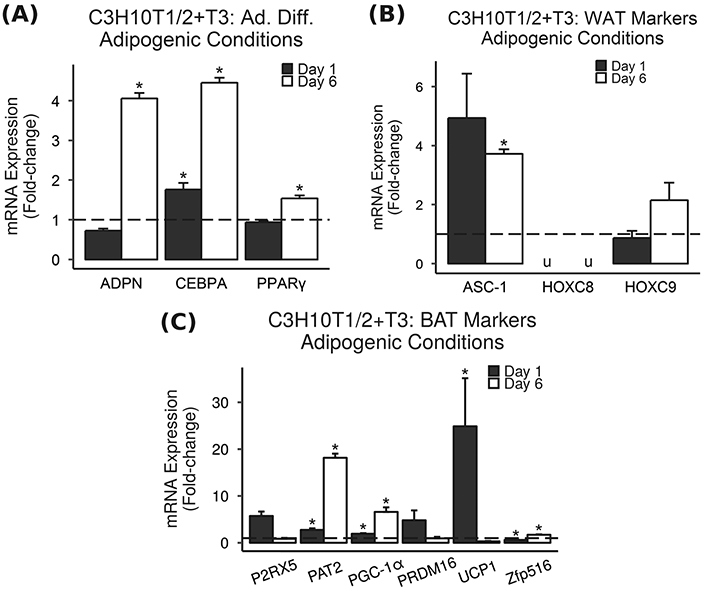
T3 increases BAT and WAT markers in C3H10T1/2 cells. Adipocyte-differentiated mouse C3H10T1/2 cells were treated with T3 under adipogenic conditions, and mRNA expression was measured via real-time RT-PCR. Results are presented as mean fold-change vs. vehicle control ± SEM (n = 3–4). * = P < 0.05 vs. vehicle control, u = could not be measured due to the detection limits of the instrument. a Adipocyte differentiation markers were increased by 10 ng/mL (15.4 nM) T3 treatment in C3H10T1/2 cells under adipogenic conditions. b WAT markers were increased by 10 ng/mL (15.4 nM) T3 treatment in C3H10T1/2 cells under adipogenic conditions. c BAT markers were significantly increased by 10 ng/mL (15.4 nM) T3 treatment in C3H10T1/2 cells under adipogenic conditions. Notably, key BAT gene UCP1 was increased 24.9-fold
